Austrian vs Immigrants from Israel Average Family Size
COMPARE
Austrian
Immigrants from Israel
Average Family Size
Average Family Size Comparison
Austrians
Immigrants from Israel
3.14
AVERAGE FAMILY SIZE
0.2/ 100
METRIC RATING
295th/ 347
METRIC RANK
3.22
AVERAGE FAMILY SIZE
29.3/ 100
METRIC RATING
193rd/ 347
METRIC RANK
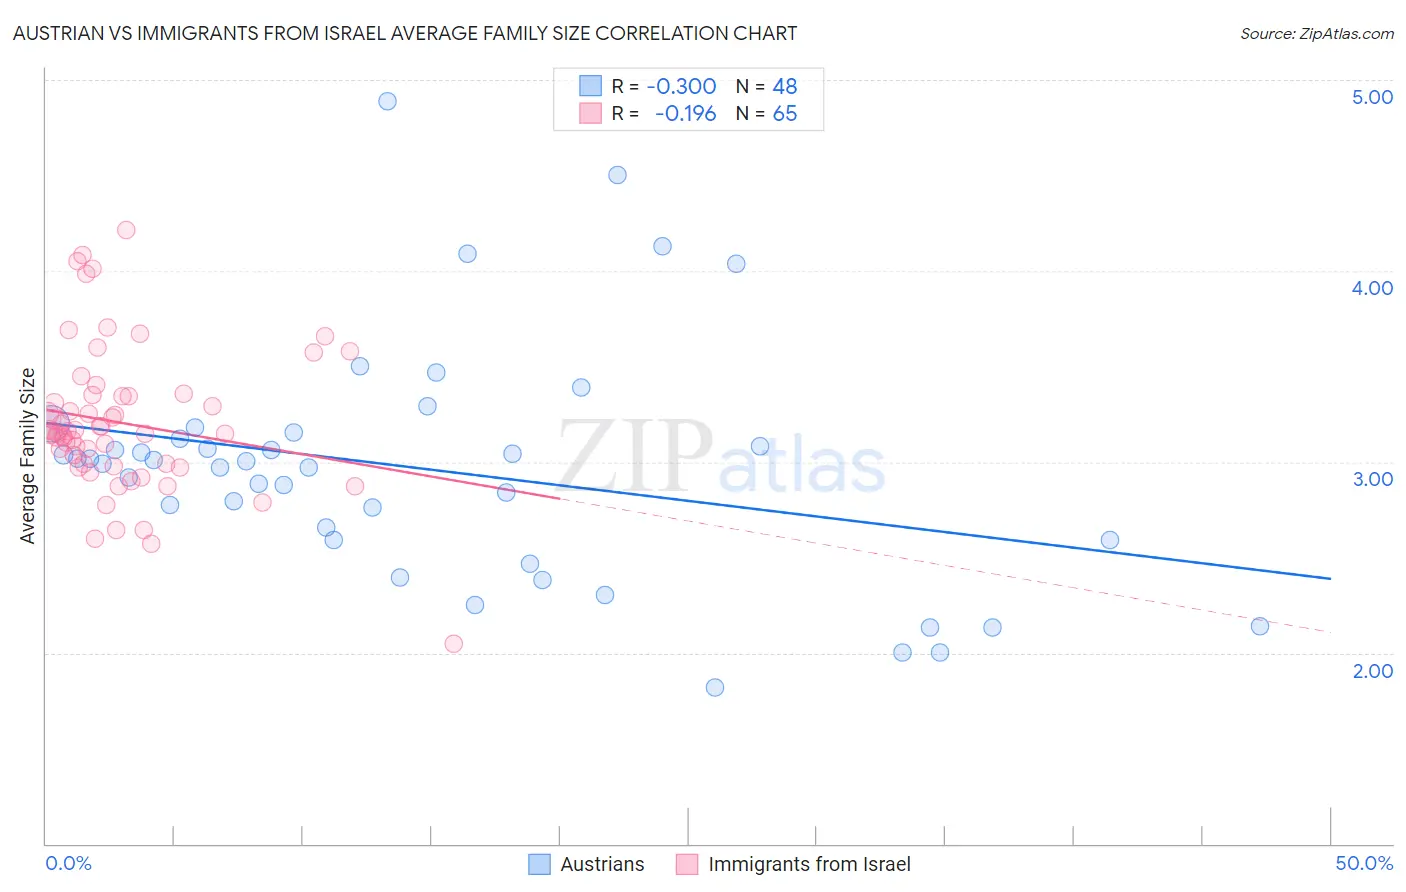
Austrian vs Immigrants from Israel Average Family Size Correlation Chart
The statistical analysis conducted on geographies consisting of 451,810,696 people shows a mild negative correlation between the proportion of Austrians and average family size in the United States with a correlation coefficient (R) of -0.300 and weighted average of 3.14. Similarly, the statistical analysis conducted on geographies consisting of 209,937,123 people shows a poor negative correlation between the proportion of Immigrants from Israel and average family size in the United States with a correlation coefficient (R) of -0.196 and weighted average of 3.22, a difference of 2.5%.
Average Family Size Correlation Summary
| Measurement | Austrian | Immigrants from Israel |
| Minimum | 1.82 | 2.05 |
| Maximum | 4.89 | 4.21 |
| Range | 3.07 | 2.16 |
| Mean | 2.96 | 3.20 |
| Median | 3.00 | 3.16 |
| Interquartile 25% (IQ1) | 2.59 | 2.98 |
| Interquartile 75% (IQ3) | 3.14 | 3.35 |
| Interquartile Range (IQR) | 0.55 | 0.36 |
| Standard Deviation (Sample) | 0.63 | 0.38 |
| Standard Deviation (Population) | 0.62 | 0.38 |
Similar Demographics by Average Family Size
Demographics Similar to Austrians by Average Family Size
In terms of average family size, the demographic groups most similar to Austrians are Ukrainian (3.14, a difference of 0.0%), Immigrants from Western Europe (3.14, a difference of 0.0%), Immigrants from Croatia (3.14, a difference of 0.010%), Colville (3.14, a difference of 0.010%), and European (3.14, a difference of 0.030%).
| Demographics | Rating | Rank | Average Family Size |
| Immigrants | Czechoslovakia | 0.3 /100 | #288 | Tragic 3.14 |
| Immigrants | Norway | 0.3 /100 | #289 | Tragic 3.14 |
| Cypriots | 0.3 /100 | #290 | Tragic 3.14 |
| Alsatians | 0.2 /100 | #291 | Tragic 3.14 |
| Europeans | 0.2 /100 | #292 | Tragic 3.14 |
| Scandinavians | 0.2 /100 | #293 | Tragic 3.14 |
| Immigrants | Croatia | 0.2 /100 | #294 | Tragic 3.14 |
| Austrians | 0.2 /100 | #295 | Tragic 3.14 |
| Ukrainians | 0.2 /100 | #296 | Tragic 3.14 |
| Immigrants | Western Europe | 0.2 /100 | #297 | Tragic 3.14 |
| Colville | 0.2 /100 | #298 | Tragic 3.14 |
| Canadians | 0.2 /100 | #299 | Tragic 3.14 |
| Immigrants | Sweden | 0.2 /100 | #300 | Tragic 3.14 |
| Macedonians | 0.2 /100 | #301 | Tragic 3.13 |
| Immigrants | Latvia | 0.2 /100 | #302 | Tragic 3.13 |
Demographics Similar to Immigrants from Israel by Average Family Size
In terms of average family size, the demographic groups most similar to Immigrants from Israel are Immigrants from Sudan (3.22, a difference of 0.0%), Immigrants from Eastern Africa (3.22, a difference of 0.020%), Choctaw (3.21, a difference of 0.020%), Senegalese (3.21, a difference of 0.020%), and Immigrants from Zaire (3.22, a difference of 0.030%).
| Demographics | Rating | Rank | Average Family Size |
| Immigrants | Argentina | 39.8 /100 | #186 | Fair 3.22 |
| Immigrants | Malaysia | 39.0 /100 | #187 | Fair 3.22 |
| Thais | 38.3 /100 | #188 | Fair 3.22 |
| Pakistanis | 33.7 /100 | #189 | Fair 3.22 |
| Burmese | 31.0 /100 | #190 | Fair 3.22 |
| Immigrants | Zaire | 30.5 /100 | #191 | Fair 3.22 |
| Immigrants | Eastern Africa | 30.1 /100 | #192 | Fair 3.22 |
| Immigrants | Israel | 29.3 /100 | #193 | Fair 3.22 |
| Immigrants | Sudan | 29.1 /100 | #194 | Fair 3.22 |
| Choctaw | 28.3 /100 | #195 | Fair 3.21 |
| Senegalese | 28.2 /100 | #196 | Fair 3.21 |
| Kenyans | 28.0 /100 | #197 | Fair 3.21 |
| Immigrants | Azores | 21.7 /100 | #198 | Fair 3.21 |
| Hmong | 20.7 /100 | #199 | Fair 3.21 |
| Immigrants | Kenya | 19.2 /100 | #200 | Poor 3.21 |