Austrian vs Lumbee Average Family Size
COMPARE
Austrian
Lumbee
Average Family Size
Average Family Size Comparison
Austrians
Lumbee
3.14
AVERAGE FAMILY SIZE
0.2/ 100
METRIC RATING
295th/ 347
METRIC RANK
3.32
AVERAGE FAMILY SIZE
99.8/ 100
METRIC RATING
80th/ 347
METRIC RANK
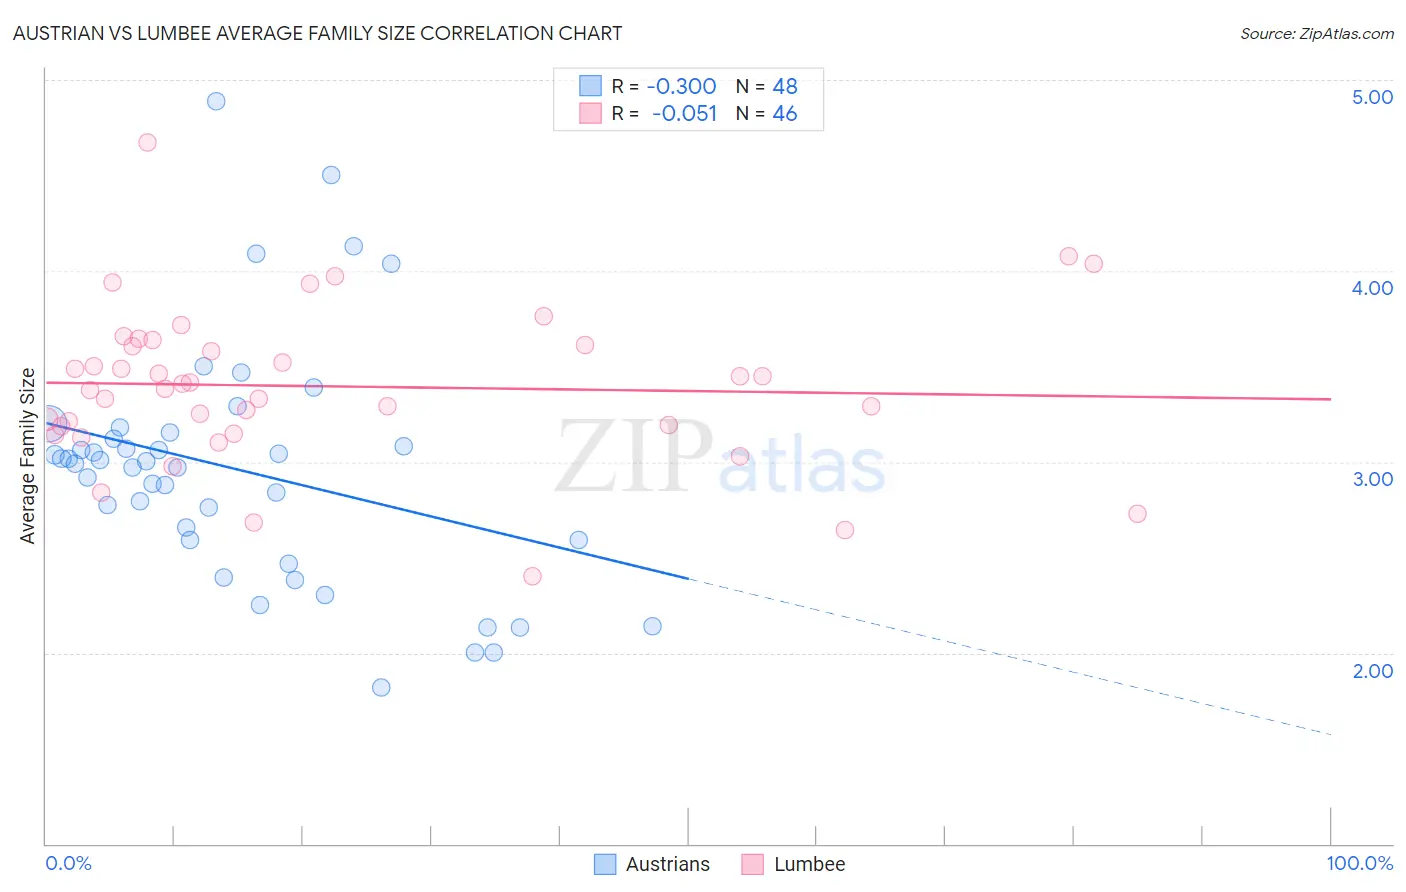
Austrian vs Lumbee Average Family Size Correlation Chart
The statistical analysis conducted on geographies consisting of 451,810,696 people shows a mild negative correlation between the proportion of Austrians and average family size in the United States with a correlation coefficient (R) of -0.300 and weighted average of 3.14. Similarly, the statistical analysis conducted on geographies consisting of 92,265,029 people shows a slight negative correlation between the proportion of Lumbee and average family size in the United States with a correlation coefficient (R) of -0.051 and weighted average of 3.32, a difference of 5.8%.
Average Family Size Correlation Summary
| Measurement | Austrian | Lumbee |
| Minimum | 1.82 | 2.40 |
| Maximum | 4.89 | 4.67 |
| Range | 3.07 | 2.27 |
| Mean | 2.96 | 3.40 |
| Median | 3.00 | 3.40 |
| Interquartile 25% (IQ1) | 2.59 | 3.19 |
| Interquartile 75% (IQ3) | 3.14 | 3.61 |
| Interquartile Range (IQR) | 0.55 | 0.42 |
| Standard Deviation (Sample) | 0.63 | 0.41 |
| Standard Deviation (Population) | 0.62 | 0.41 |
Similar Demographics by Average Family Size
Demographics Similar to Austrians by Average Family Size
In terms of average family size, the demographic groups most similar to Austrians are Ukrainian (3.14, a difference of 0.0%), Immigrants from Western Europe (3.14, a difference of 0.0%), Immigrants from Croatia (3.14, a difference of 0.010%), Colville (3.14, a difference of 0.010%), and European (3.14, a difference of 0.030%).
| Demographics | Rating | Rank | Average Family Size |
| Immigrants | Czechoslovakia | 0.3 /100 | #288 | Tragic 3.14 |
| Immigrants | Norway | 0.3 /100 | #289 | Tragic 3.14 |
| Cypriots | 0.3 /100 | #290 | Tragic 3.14 |
| Alsatians | 0.2 /100 | #291 | Tragic 3.14 |
| Europeans | 0.2 /100 | #292 | Tragic 3.14 |
| Scandinavians | 0.2 /100 | #293 | Tragic 3.14 |
| Immigrants | Croatia | 0.2 /100 | #294 | Tragic 3.14 |
| Austrians | 0.2 /100 | #295 | Tragic 3.14 |
| Ukrainians | 0.2 /100 | #296 | Tragic 3.14 |
| Immigrants | Western Europe | 0.2 /100 | #297 | Tragic 3.14 |
| Colville | 0.2 /100 | #298 | Tragic 3.14 |
| Canadians | 0.2 /100 | #299 | Tragic 3.14 |
| Immigrants | Sweden | 0.2 /100 | #300 | Tragic 3.14 |
| Macedonians | 0.2 /100 | #301 | Tragic 3.13 |
| Immigrants | Latvia | 0.2 /100 | #302 | Tragic 3.13 |
Demographics Similar to Lumbee by Average Family Size
In terms of average family size, the demographic groups most similar to Lumbee are British West Indian (3.32, a difference of 0.020%), Immigrants from Micronesia (3.32, a difference of 0.030%), Immigrants from Dominica (3.32, a difference of 0.040%), Immigrants from Ecuador (3.32, a difference of 0.070%), and Trinidadian and Tobagonian (3.32, a difference of 0.080%).
| Demographics | Rating | Rank | Average Family Size |
| Yaqui | 99.9 /100 | #73 | Exceptional 3.32 |
| Immigrants | Sierra Leone | 99.9 /100 | #74 | Exceptional 3.32 |
| Immigrants | Barbados | 99.8 /100 | #75 | Exceptional 3.32 |
| Trinidadians and Tobagonians | 99.8 /100 | #76 | Exceptional 3.32 |
| Immigrants | Ecuador | 99.8 /100 | #77 | Exceptional 3.32 |
| Immigrants | Micronesia | 99.8 /100 | #78 | Exceptional 3.32 |
| British West Indians | 99.8 /100 | #79 | Exceptional 3.32 |
| Lumbee | 99.8 /100 | #80 | Exceptional 3.32 |
| Immigrants | Dominica | 99.8 /100 | #81 | Exceptional 3.32 |
| Ecuadorians | 99.8 /100 | #82 | Exceptional 3.32 |
| Immigrants | Afghanistan | 99.8 /100 | #83 | Exceptional 3.32 |
| Immigrants | Nigeria | 99.7 /100 | #84 | Exceptional 3.32 |
| Afghans | 99.7 /100 | #85 | Exceptional 3.31 |
| Jamaicans | 99.7 /100 | #86 | Exceptional 3.31 |
| Immigrants | Peru | 99.7 /100 | #87 | Exceptional 3.31 |