Austrian vs Macedonian Average Family Size
COMPARE
Austrian
Macedonian
Average Family Size
Average Family Size Comparison
Austrians
Macedonians
3.14
AVERAGE FAMILY SIZE
0.2/ 100
METRIC RATING
295th/ 347
METRIC RANK
3.13
AVERAGE FAMILY SIZE
0.2/ 100
METRIC RATING
301st/ 347
METRIC RANK
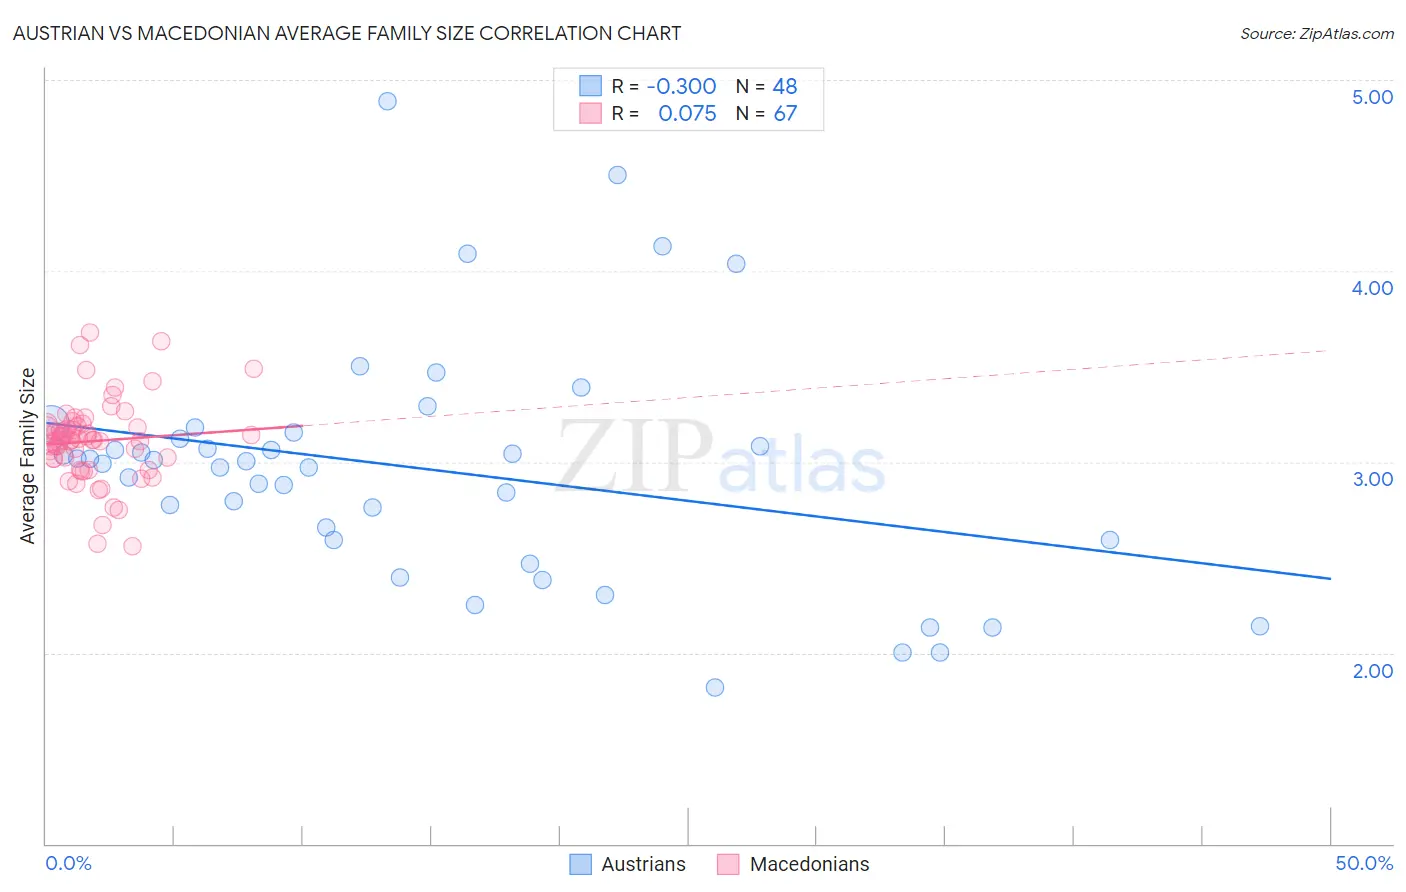
Austrian vs Macedonian Average Family Size Correlation Chart
The statistical analysis conducted on geographies consisting of 451,810,696 people shows a mild negative correlation between the proportion of Austrians and average family size in the United States with a correlation coefficient (R) of -0.300 and weighted average of 3.14. Similarly, the statistical analysis conducted on geographies consisting of 132,621,660 people shows a slight positive correlation between the proportion of Macedonians and average family size in the United States with a correlation coefficient (R) of 0.075 and weighted average of 3.13, a difference of 0.13%.
Average Family Size Correlation Summary
| Measurement | Austrian | Macedonian |
| Minimum | 1.82 | 2.56 |
| Maximum | 4.89 | 3.68 |
| Range | 3.07 | 1.12 |
| Mean | 2.96 | 3.11 |
| Median | 3.00 | 3.12 |
| Interquartile 25% (IQ1) | 2.59 | 3.02 |
| Interquartile 75% (IQ3) | 3.14 | 3.19 |
| Interquartile Range (IQR) | 0.55 | 0.17 |
| Standard Deviation (Sample) | 0.63 | 0.21 |
| Standard Deviation (Population) | 0.62 | 0.21 |
Demographics Similar to Austrians and Macedonians by Average Family Size
In terms of average family size, the demographic groups most similar to Austrians are Ukrainian (3.14, a difference of 0.0%), Immigrants from Western Europe (3.14, a difference of 0.0%), Immigrants from Croatia (3.14, a difference of 0.010%), Colville (3.14, a difference of 0.010%), and European (3.14, a difference of 0.030%). Similarly, the demographic groups most similar to Macedonians are Immigrants from Latvia (3.13, a difference of 0.0%), British (3.13, a difference of 0.010%), Immigrants from Switzerland (3.13, a difference of 0.030%), Australian (3.13, a difference of 0.060%), and Immigrants from Sweden (3.14, a difference of 0.070%).
| Demographics | Rating | Rank | Average Family Size |
| Immigrants | Czechoslovakia | 0.3 /100 | #288 | Tragic 3.14 |
| Immigrants | Norway | 0.3 /100 | #289 | Tragic 3.14 |
| Cypriots | 0.3 /100 | #290 | Tragic 3.14 |
| Alsatians | 0.2 /100 | #291 | Tragic 3.14 |
| Europeans | 0.2 /100 | #292 | Tragic 3.14 |
| Scandinavians | 0.2 /100 | #293 | Tragic 3.14 |
| Immigrants | Croatia | 0.2 /100 | #294 | Tragic 3.14 |
| Austrians | 0.2 /100 | #295 | Tragic 3.14 |
| Ukrainians | 0.2 /100 | #296 | Tragic 3.14 |
| Immigrants | Western Europe | 0.2 /100 | #297 | Tragic 3.14 |
| Colville | 0.2 /100 | #298 | Tragic 3.14 |
| Canadians | 0.2 /100 | #299 | Tragic 3.14 |
| Immigrants | Sweden | 0.2 /100 | #300 | Tragic 3.14 |
| Macedonians | 0.2 /100 | #301 | Tragic 3.13 |
| Immigrants | Latvia | 0.2 /100 | #302 | Tragic 3.13 |
| British | 0.2 /100 | #303 | Tragic 3.13 |
| Immigrants | Switzerland | 0.2 /100 | #304 | Tragic 3.13 |
| Australians | 0.1 /100 | #305 | Tragic 3.13 |
| Immigrants | Ireland | 0.1 /100 | #306 | Tragic 3.13 |
| Immigrants | Serbia | 0.1 /100 | #307 | Tragic 3.13 |
| Slavs | 0.1 /100 | #308 | Tragic 3.13 |