Austrian vs Immigrants from Northern Europe Average Family Size
COMPARE
Austrian
Immigrants from Northern Europe
Average Family Size
Average Family Size Comparison
Austrians
Immigrants from Northern Europe
3.14
AVERAGE FAMILY SIZE
0.2/ 100
METRIC RATING
295th/ 347
METRIC RANK
3.13
AVERAGE FAMILY SIZE
0.1/ 100
METRIC RATING
311th/ 347
METRIC RANK
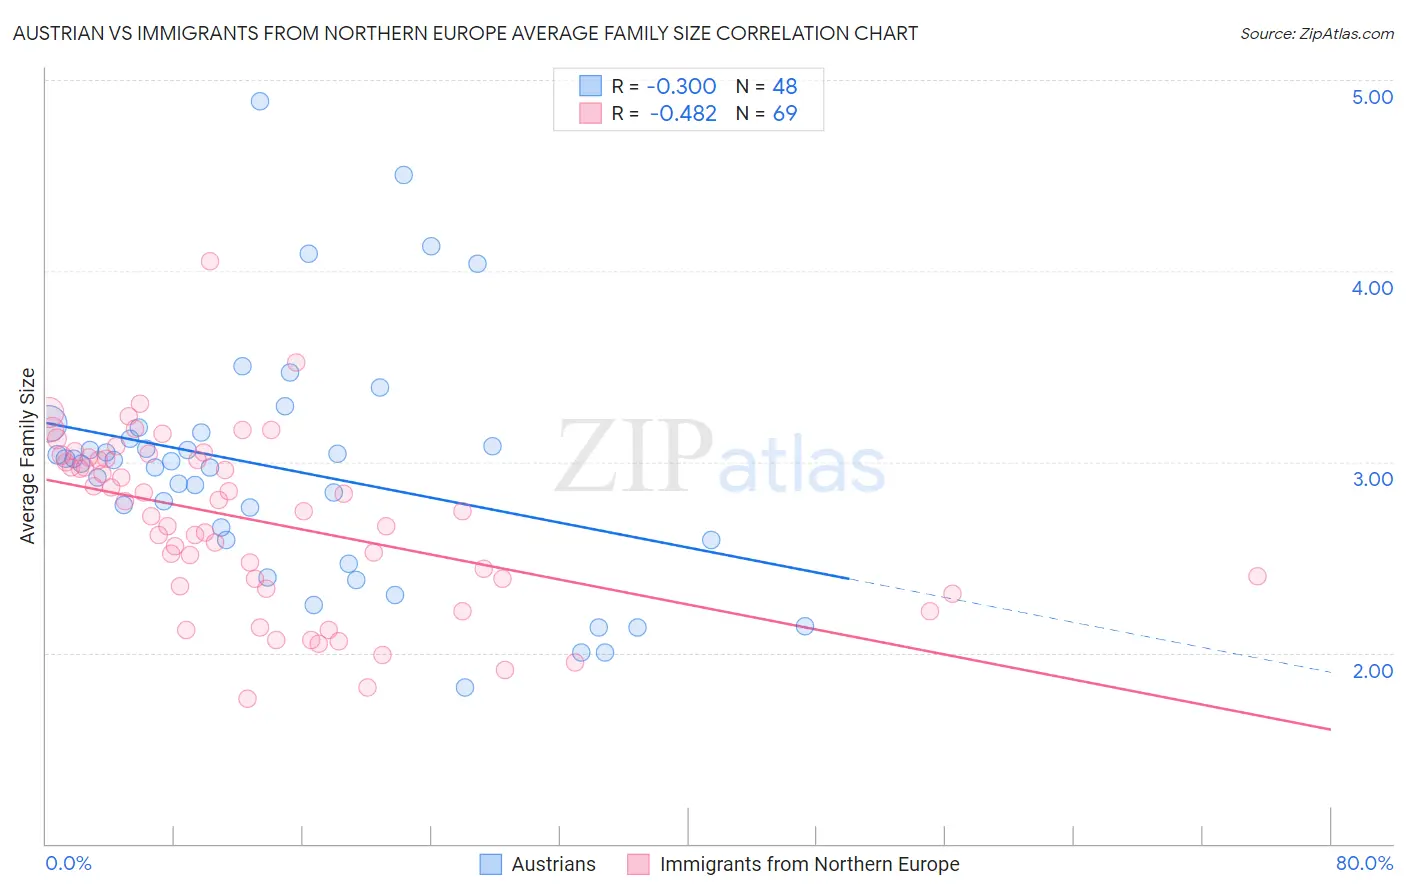
Austrian vs Immigrants from Northern Europe Average Family Size Correlation Chart
The statistical analysis conducted on geographies consisting of 451,810,696 people shows a mild negative correlation between the proportion of Austrians and average family size in the United States with a correlation coefficient (R) of -0.300 and weighted average of 3.14. Similarly, the statistical analysis conducted on geographies consisting of 476,950,566 people shows a moderate negative correlation between the proportion of Immigrants from Northern Europe and average family size in the United States with a correlation coefficient (R) of -0.482 and weighted average of 3.13, a difference of 0.38%.
Average Family Size Correlation Summary
| Measurement | Austrian | Immigrants from Northern Europe |
| Minimum | 1.82 | 1.76 |
| Maximum | 4.89 | 4.05 |
| Range | 3.07 | 2.29 |
| Mean | 2.96 | 2.69 |
| Median | 3.00 | 2.74 |
| Interquartile 25% (IQ1) | 2.59 | 2.37 |
| Interquartile 75% (IQ3) | 3.14 | 3.02 |
| Interquartile Range (IQR) | 0.55 | 0.65 |
| Standard Deviation (Sample) | 0.63 | 0.45 |
| Standard Deviation (Population) | 0.62 | 0.45 |
Demographics Similar to Austrians and Immigrants from Northern Europe by Average Family Size
In terms of average family size, the demographic groups most similar to Austrians are Ukrainian (3.14, a difference of 0.0%), Immigrants from Western Europe (3.14, a difference of 0.0%), Immigrants from Croatia (3.14, a difference of 0.010%), Colville (3.14, a difference of 0.010%), and Scandinavian (3.14, a difference of 0.030%). Similarly, the demographic groups most similar to Immigrants from Northern Europe are Immigrants from Australia (3.13, a difference of 0.020%), Bulgarian (3.13, a difference of 0.030%), Czechoslovakian (3.13, a difference of 0.040%), Northern European (3.13, a difference of 0.060%), and Slavic (3.13, a difference of 0.070%).
| Demographics | Rating | Rank | Average Family Size |
| Scandinavians | 0.2 /100 | #293 | Tragic 3.14 |
| Immigrants | Croatia | 0.2 /100 | #294 | Tragic 3.14 |
| Austrians | 0.2 /100 | #295 | Tragic 3.14 |
| Ukrainians | 0.2 /100 | #296 | Tragic 3.14 |
| Immigrants | Western Europe | 0.2 /100 | #297 | Tragic 3.14 |
| Colville | 0.2 /100 | #298 | Tragic 3.14 |
| Canadians | 0.2 /100 | #299 | Tragic 3.14 |
| Immigrants | Sweden | 0.2 /100 | #300 | Tragic 3.14 |
| Macedonians | 0.2 /100 | #301 | Tragic 3.13 |
| Immigrants | Latvia | 0.2 /100 | #302 | Tragic 3.13 |
| British | 0.2 /100 | #303 | Tragic 3.13 |
| Immigrants | Switzerland | 0.2 /100 | #304 | Tragic 3.13 |
| Australians | 0.1 /100 | #305 | Tragic 3.13 |
| Immigrants | Ireland | 0.1 /100 | #306 | Tragic 3.13 |
| Immigrants | Serbia | 0.1 /100 | #307 | Tragic 3.13 |
| Slavs | 0.1 /100 | #308 | Tragic 3.13 |
| Northern Europeans | 0.1 /100 | #309 | Tragic 3.13 |
| Czechoslovakians | 0.1 /100 | #310 | Tragic 3.13 |
| Immigrants | Northern Europe | 0.1 /100 | #311 | Tragic 3.13 |
| Immigrants | Australia | 0.1 /100 | #312 | Tragic 3.13 |
| Bulgarians | 0.1 /100 | #313 | Tragic 3.13 |