Nepalese vs South African Average Family Size
COMPARE
Nepalese
South African
Average Family Size
Average Family Size Comparison
Nepalese
South Africans
3.42
AVERAGE FAMILY SIZE
100.0/ 100
METRIC RATING
29th/ 347
METRIC RANK
3.17
AVERAGE FAMILY SIZE
1.7/ 100
METRIC RATING
253rd/ 347
METRIC RANK
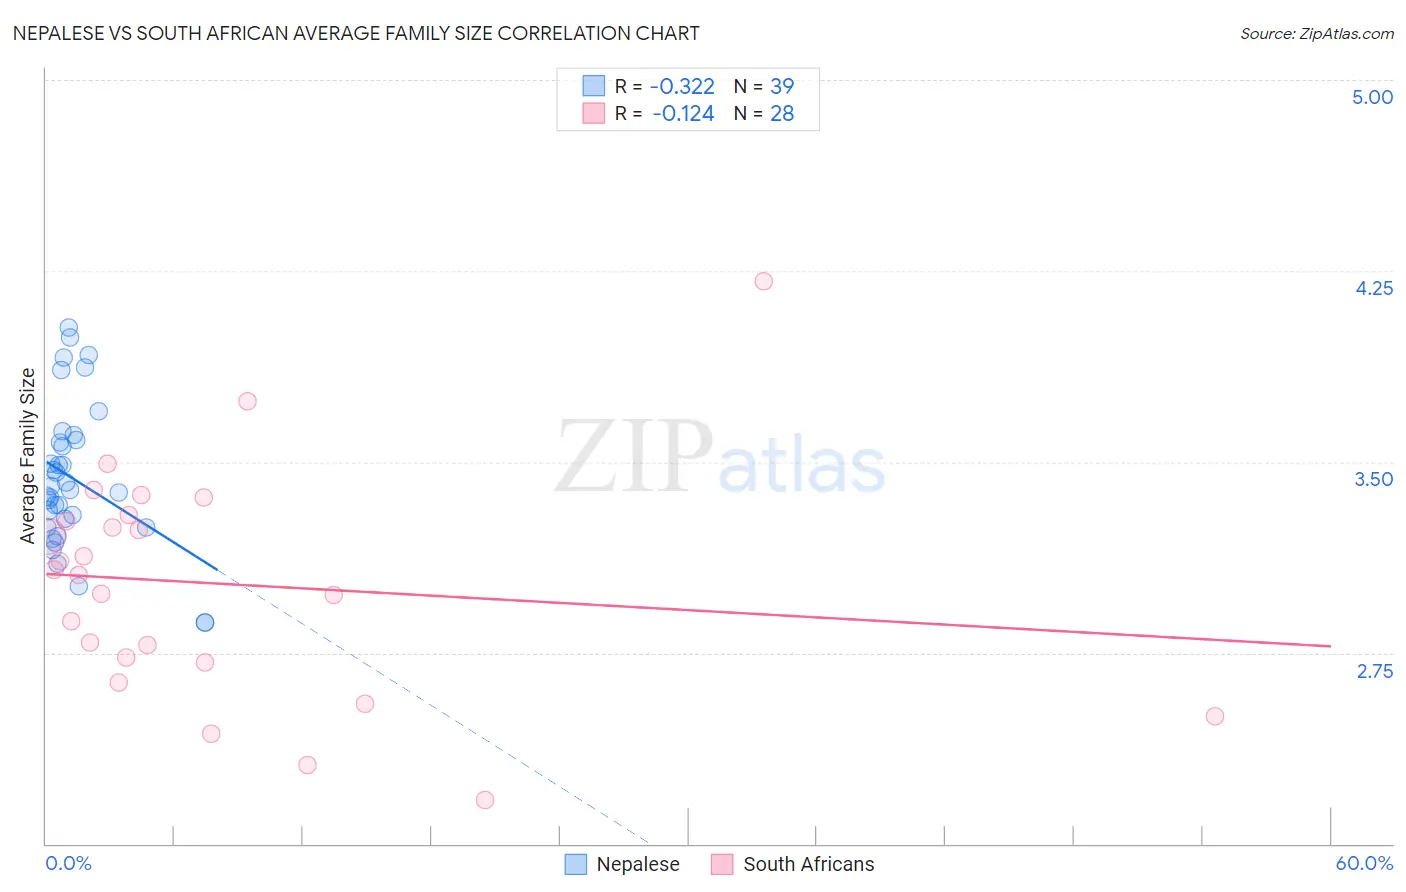
Nepalese vs South African Average Family Size Correlation Chart
The statistical analysis conducted on geographies consisting of 24,519,269 people shows a mild negative correlation between the proportion of Nepalese and average family size in the United States with a correlation coefficient (R) of -0.322 and weighted average of 3.42. Similarly, the statistical analysis conducted on geographies consisting of 182,542,569 people shows a poor negative correlation between the proportion of South Africans and average family size in the United States with a correlation coefficient (R) of -0.124 and weighted average of 3.17, a difference of 8.0%.
Average Family Size Correlation Summary
| Measurement | Nepalese | South African |
| Minimum | 2.87 | 2.17 |
| Maximum | 4.03 | 4.21 |
| Range | 1.16 | 2.04 |
| Mean | 3.43 | 3.02 |
| Median | 3.39 | 3.07 |
| Interquartile 25% (IQ1) | 3.24 | 2.72 |
| Interquartile 75% (IQ3) | 3.59 | 3.28 |
| Interquartile Range (IQR) | 0.34 | 0.56 |
| Standard Deviation (Sample) | 0.28 | 0.44 |
| Standard Deviation (Population) | 0.28 | 0.44 |
Similar Demographics by Average Family Size
Demographics Similar to Nepalese by Average Family Size
In terms of average family size, the demographic groups most similar to Nepalese are Samoan (3.42, a difference of 0.030%), Immigrants from Latin America (3.42, a difference of 0.090%), Mexican American Indian (3.43, a difference of 0.21%), Native Hawaiian (3.43, a difference of 0.22%), and Central American (3.41, a difference of 0.23%).
| Demographics | Rating | Rank | Average Family Size |
| Apache | 100.0 /100 | #22 | Exceptional 3.46 |
| Immigrants | Fiji | 100.0 /100 | #23 | Exceptional 3.45 |
| Natives/Alaskans | 100.0 /100 | #24 | Exceptional 3.45 |
| Yakama | 100.0 /100 | #25 | Exceptional 3.45 |
| Native Hawaiians | 100.0 /100 | #26 | Exceptional 3.43 |
| Mexican American Indians | 100.0 /100 | #27 | Exceptional 3.43 |
| Immigrants | Latin America | 100.0 /100 | #28 | Exceptional 3.42 |
| Nepalese | 100.0 /100 | #29 | Exceptional 3.42 |
| Samoans | 100.0 /100 | #30 | Exceptional 3.42 |
| Central Americans | 100.0 /100 | #31 | Exceptional 3.41 |
| Immigrants | Guatemala | 100.0 /100 | #32 | Exceptional 3.41 |
| Hawaiians | 100.0 /100 | #33 | Exceptional 3.41 |
| Hispanics or Latinos | 100.0 /100 | #34 | Exceptional 3.41 |
| Guatemalans | 100.0 /100 | #35 | Exceptional 3.40 |
| Immigrants | Guyana | 100.0 /100 | #36 | Exceptional 3.40 |
Demographics Similar to South Africans by Average Family Size
In terms of average family size, the demographic groups most similar to South Africans are Immigrants from Saudi Arabia (3.17, a difference of 0.0%), Immigrants from Hungary (3.17, a difference of 0.0%), Cape Verdean (3.17, a difference of 0.020%), Immigrants from Spain (3.17, a difference of 0.030%), and Puget Sound Salish (3.17, a difference of 0.040%).
| Demographics | Rating | Rank | Average Family Size |
| Danes | 2.5 /100 | #246 | Tragic 3.17 |
| Cajuns | 2.4 /100 | #247 | Tragic 3.17 |
| Immigrants | Belarus | 2.3 /100 | #248 | Tragic 3.17 |
| Immigrants | Eastern Europe | 2.1 /100 | #249 | Tragic 3.17 |
| Puget Sound Salish | 1.9 /100 | #250 | Tragic 3.17 |
| Immigrants | Spain | 1.8 /100 | #251 | Tragic 3.17 |
| Immigrants | Saudi Arabia | 1.7 /100 | #252 | Tragic 3.17 |
| South Africans | 1.7 /100 | #253 | Tragic 3.17 |
| Immigrants | Hungary | 1.7 /100 | #254 | Tragic 3.17 |
| Cape Verdeans | 1.6 /100 | #255 | Tragic 3.17 |
| Immigrants | Kazakhstan | 1.5 /100 | #256 | Tragic 3.17 |
| Albanians | 1.5 /100 | #257 | Tragic 3.17 |
| Turks | 1.3 /100 | #258 | Tragic 3.16 |
| Potawatomi | 1.3 /100 | #259 | Tragic 3.16 |
| Immigrants | Albania | 1.3 /100 | #260 | Tragic 3.16 |