Malaysian vs Immigrants from Ghana Average Family Size
COMPARE
Malaysian
Immigrants from Ghana
Average Family Size
Average Family Size Comparison
Malaysians
Immigrants from Ghana
3.31
AVERAGE FAMILY SIZE
99.6/ 100
METRIC RATING
89th/ 347
METRIC RANK
3.29
AVERAGE FAMILY SIZE
98.1/ 100
METRIC RATING
105th/ 347
METRIC RANK
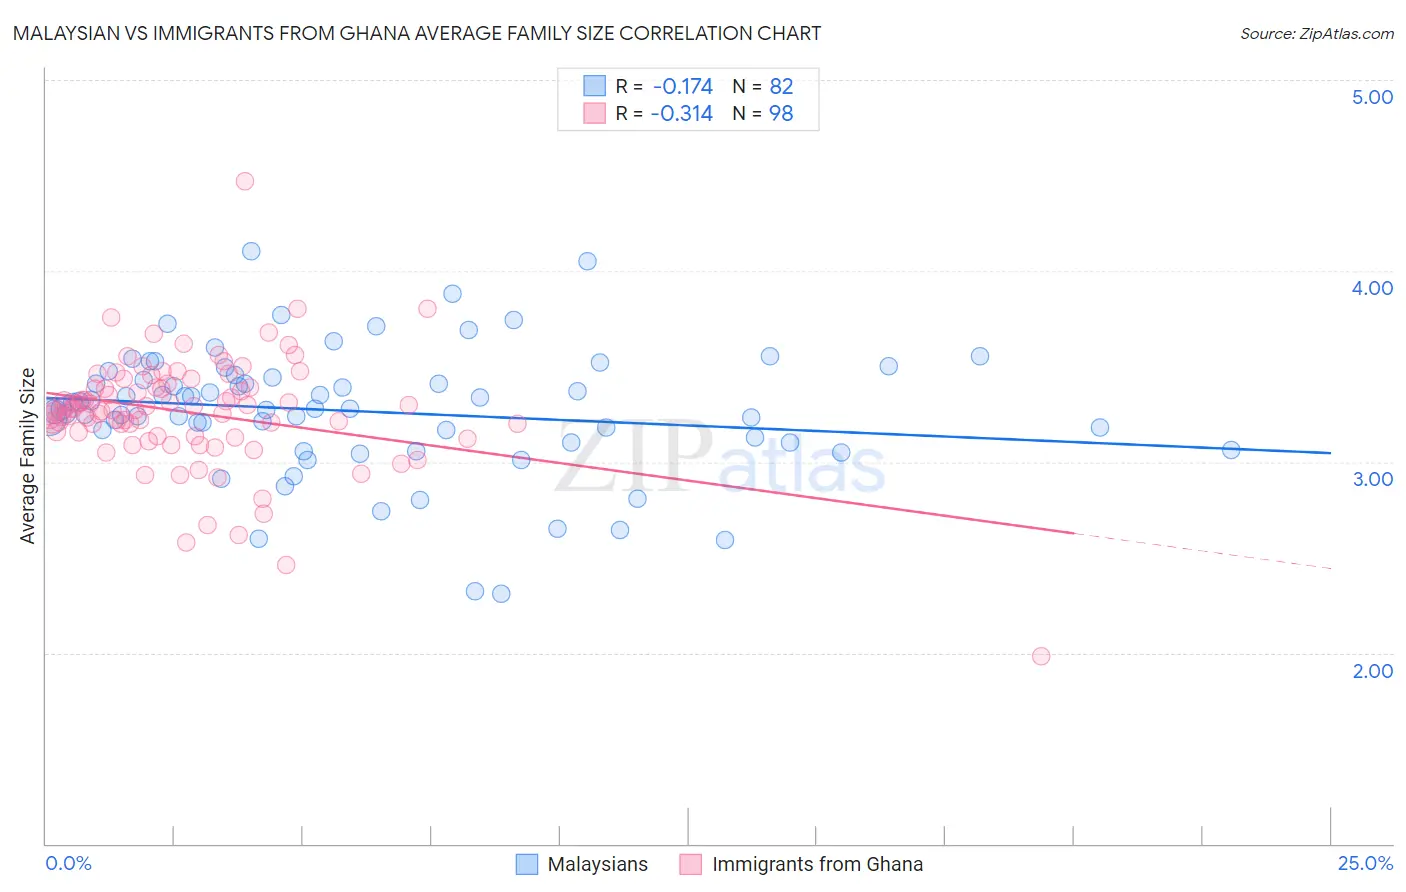
Malaysian vs Immigrants from Ghana Average Family Size Correlation Chart
The statistical analysis conducted on geographies consisting of 226,011,671 people shows a poor negative correlation between the proportion of Malaysians and average family size in the United States with a correlation coefficient (R) of -0.174 and weighted average of 3.31. Similarly, the statistical analysis conducted on geographies consisting of 199,809,831 people shows a mild negative correlation between the proportion of Immigrants from Ghana and average family size in the United States with a correlation coefficient (R) of -0.314 and weighted average of 3.29, a difference of 0.66%.
Average Family Size Correlation Summary
| Measurement | Malaysian | Immigrants from Ghana |
| Minimum | 2.31 | 1.98 |
| Maximum | 4.10 | 4.47 |
| Range | 1.79 | 2.49 |
| Mean | 3.26 | 3.26 |
| Median | 3.28 | 3.27 |
| Interquartile 25% (IQ1) | 3.10 | 3.14 |
| Interquartile 75% (IQ3) | 3.44 | 3.39 |
| Interquartile Range (IQR) | 0.34 | 0.25 |
| Standard Deviation (Sample) | 0.33 | 0.30 |
| Standard Deviation (Population) | 0.33 | 0.30 |
Demographics Similar to Malaysians and Immigrants from Ghana by Average Family Size
In terms of average family size, the demographic groups most similar to Malaysians are Immigrants from Bolivia (3.31, a difference of 0.010%), Immigrants from Peru (3.31, a difference of 0.10%), Menominee (3.30, a difference of 0.11%), Immigrants from Pakistan (3.30, a difference of 0.26%), and Immigrants from Cameroon (3.30, a difference of 0.27%). Similarly, the demographic groups most similar to Immigrants from Ghana are Paiute (3.29, a difference of 0.020%), Ghanaian (3.29, a difference of 0.030%), Bolivian (3.29, a difference of 0.050%), Immigrants from Western Africa (3.29, a difference of 0.090%), and West Indian (3.29, a difference of 0.12%).
| Demographics | Rating | Rank | Average Family Size |
| Immigrants | Peru | 99.7 /100 | #87 | Exceptional 3.31 |
| Immigrants | Bolivia | 99.6 /100 | #88 | Exceptional 3.31 |
| Malaysians | 99.6 /100 | #89 | Exceptional 3.31 |
| Menominee | 99.4 /100 | #90 | Exceptional 3.30 |
| Immigrants | Pakistan | 99.2 /100 | #91 | Exceptional 3.30 |
| Immigrants | Cameroon | 99.2 /100 | #92 | Exceptional 3.30 |
| Peruvians | 99.2 /100 | #93 | Exceptional 3.30 |
| Sierra Leoneans | 99.0 /100 | #94 | Exceptional 3.30 |
| Immigrants | Lebanon | 99.0 /100 | #95 | Exceptional 3.30 |
| U.S. Virgin Islanders | 98.8 /100 | #96 | Exceptional 3.29 |
| Immigrants | Oceania | 98.7 /100 | #97 | Exceptional 3.29 |
| Barbadians | 98.6 /100 | #98 | Exceptional 3.29 |
| Nigerians | 98.6 /100 | #99 | Exceptional 3.29 |
| Guamanians/Chamorros | 98.6 /100 | #100 | Exceptional 3.29 |
| Immigrants | Burma/Myanmar | 98.6 /100 | #101 | Exceptional 3.29 |
| West Indians | 98.5 /100 | #102 | Exceptional 3.29 |
| Immigrants | Western Africa | 98.4 /100 | #103 | Exceptional 3.29 |
| Bolivians | 98.3 /100 | #104 | Exceptional 3.29 |
| Immigrants | Ghana | 98.1 /100 | #105 | Exceptional 3.29 |
| Paiute | 98.0 /100 | #106 | Exceptional 3.29 |
| Ghanaians | 98.0 /100 | #107 | Exceptional 3.29 |