Austrian vs Immigrants from Ghana In Labor Force | Age 45-54
COMPARE
Austrian
Immigrants from Ghana
In Labor Force | Age 45-54
In Labor Force | Age 45-54 Comparison
Austrians
Immigrants from Ghana
83.0%
IN LABOR FORCE | AGE 45-54
81.3/ 100
METRIC RATING
135th/ 347
METRIC RANK
82.9%
IN LABOR FORCE | AGE 45-54
70.3/ 100
METRIC RATING
154th/ 347
METRIC RANK
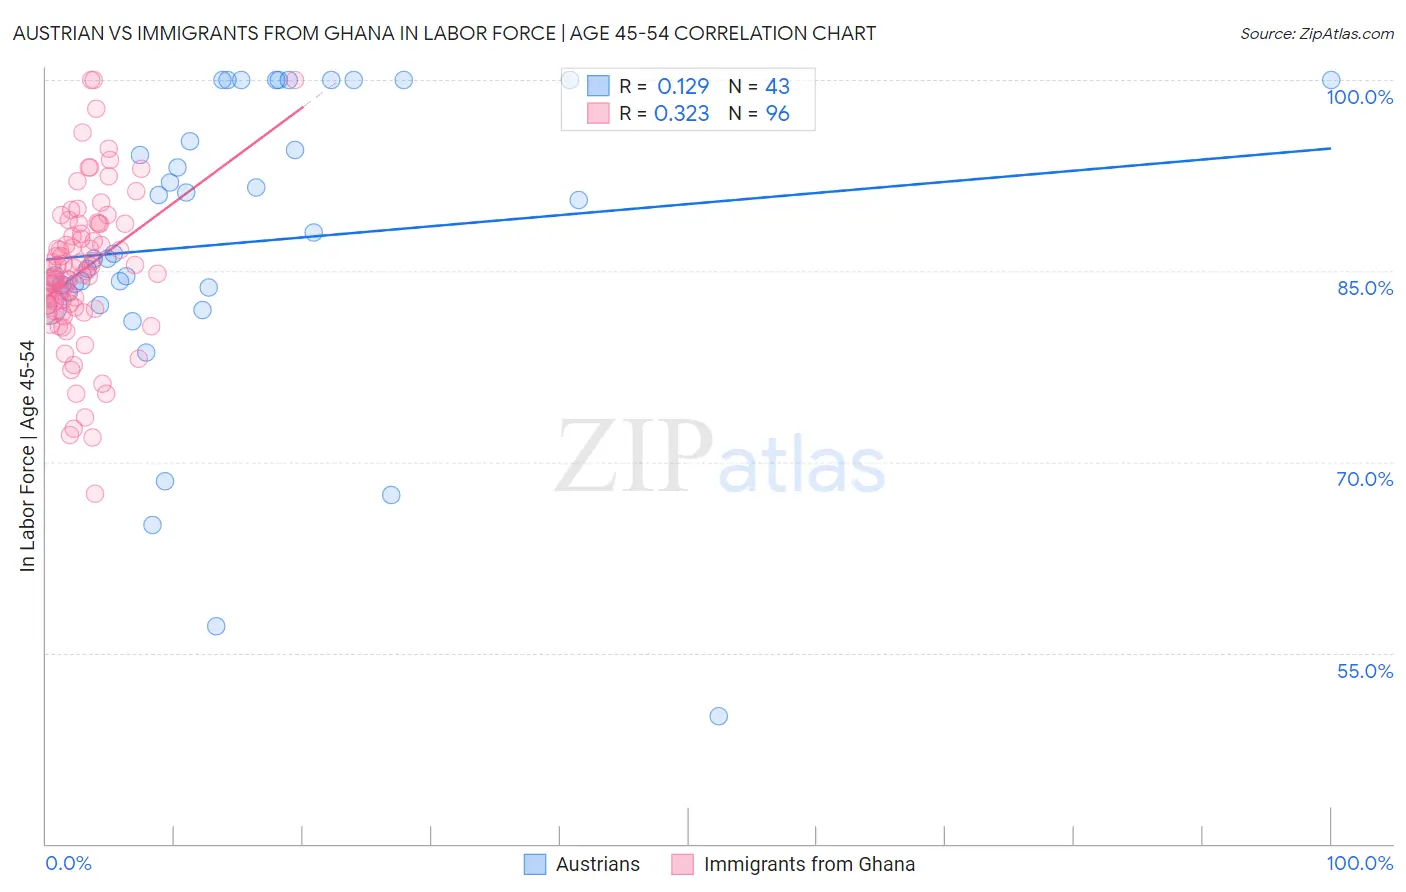
Austrian vs Immigrants from Ghana In Labor Force | Age 45-54 Correlation Chart
The statistical analysis conducted on geographies consisting of 451,779,620 people shows a poor positive correlation between the proportion of Austrians and labor force participation rate among population between the ages 45 and 54 in the United States with a correlation coefficient (R) of 0.129 and weighted average of 83.0%. Similarly, the statistical analysis conducted on geographies consisting of 199,808,244 people shows a mild positive correlation between the proportion of Immigrants from Ghana and labor force participation rate among population between the ages 45 and 54 in the United States with a correlation coefficient (R) of 0.323 and weighted average of 82.9%, a difference of 0.13%.
In Labor Force | Age 45-54 Correlation Summary
| Measurement | Austrian | Immigrants from Ghana |
| Minimum | 50.0% | 67.5% |
| Maximum | 100.0% | 100.0% |
| Range | 50.0% | 32.5% |
| Mean | 87.2% | 85.0% |
| Median | 86.4% | 84.7% |
| Interquartile 25% (IQ1) | 83.3% | 82.1% |
| Interquartile 75% (IQ3) | 100.0% | 88.3% |
| Interquartile Range (IQR) | 16.7% | 6.2% |
| Standard Deviation (Sample) | 11.8% | 6.0% |
| Standard Deviation (Population) | 11.7% | 5.9% |
Demographics Similar to Austrians and Immigrants from Ghana by In Labor Force | Age 45-54
In terms of in labor force | age 45-54, the demographic groups most similar to Austrians are Immigrants from Kazakhstan (83.0%, a difference of 0.0%), Sudanese (83.0%, a difference of 0.010%), Immigrants from Spain (83.0%, a difference of 0.010%), Ghanaian (83.0%, a difference of 0.020%), and Scandinavian (83.0%, a difference of 0.040%). Similarly, the demographic groups most similar to Immigrants from Ghana are Immigrants from Indonesia (82.9%, a difference of 0.0%), Slavic (82.9%, a difference of 0.010%), Immigrants from Netherlands (82.9%, a difference of 0.020%), Korean (82.9%, a difference of 0.020%), and Immigrants from Sweden (82.9%, a difference of 0.030%).
| Demographics | Rating | Rank | In Labor Force | Age 45-54 |
| Sudanese | 82.0 /100 | #134 | Excellent 83.0% |
| Austrians | 81.3 /100 | #135 | Excellent 83.0% |
| Immigrants | Kazakhstan | 81.0 /100 | #136 | Excellent 83.0% |
| Immigrants | Spain | 80.4 /100 | #137 | Excellent 83.0% |
| Ghanaians | 79.5 /100 | #138 | Good 83.0% |
| Scandinavians | 78.5 /100 | #139 | Good 83.0% |
| Yugoslavians | 78.3 /100 | #140 | Good 83.0% |
| Immigrants | Haiti | 77.9 /100 | #141 | Good 83.0% |
| Immigrants | Scotland | 77.8 /100 | #142 | Good 83.0% |
| Okinawans | 77.0 /100 | #143 | Good 83.0% |
| Soviet Union | 76.8 /100 | #144 | Good 83.0% |
| Romanians | 75.4 /100 | #145 | Good 83.0% |
| Immigrants | France | 75.3 /100 | #146 | Good 83.0% |
| Czechoslovakians | 74.8 /100 | #147 | Good 83.0% |
| Immigrants | Nigeria | 74.1 /100 | #148 | Good 83.0% |
| Immigrants | Sweden | 73.3 /100 | #149 | Good 82.9% |
| Immigrants | Netherlands | 72.6 /100 | #150 | Good 82.9% |
| Koreans | 71.9 /100 | #151 | Good 82.9% |
| Slavs | 71.5 /100 | #152 | Good 82.9% |
| Immigrants | Indonesia | 70.6 /100 | #153 | Good 82.9% |
| Immigrants | Ghana | 70.3 /100 | #154 | Good 82.9% |