Assyrian/Chaldean/Syriac vs Immigrants from Ghana Average Family Size
COMPARE
Assyrian/Chaldean/Syriac
Immigrants from Ghana
Average Family Size
Average Family Size Comparison
Assyrians/Chaldeans/Syriacs
Immigrants from Ghana
3.24
AVERAGE FAMILY SIZE
73.8/ 100
METRIC RATING
149th/ 347
METRIC RANK
3.29
AVERAGE FAMILY SIZE
98.1/ 100
METRIC RATING
105th/ 347
METRIC RANK
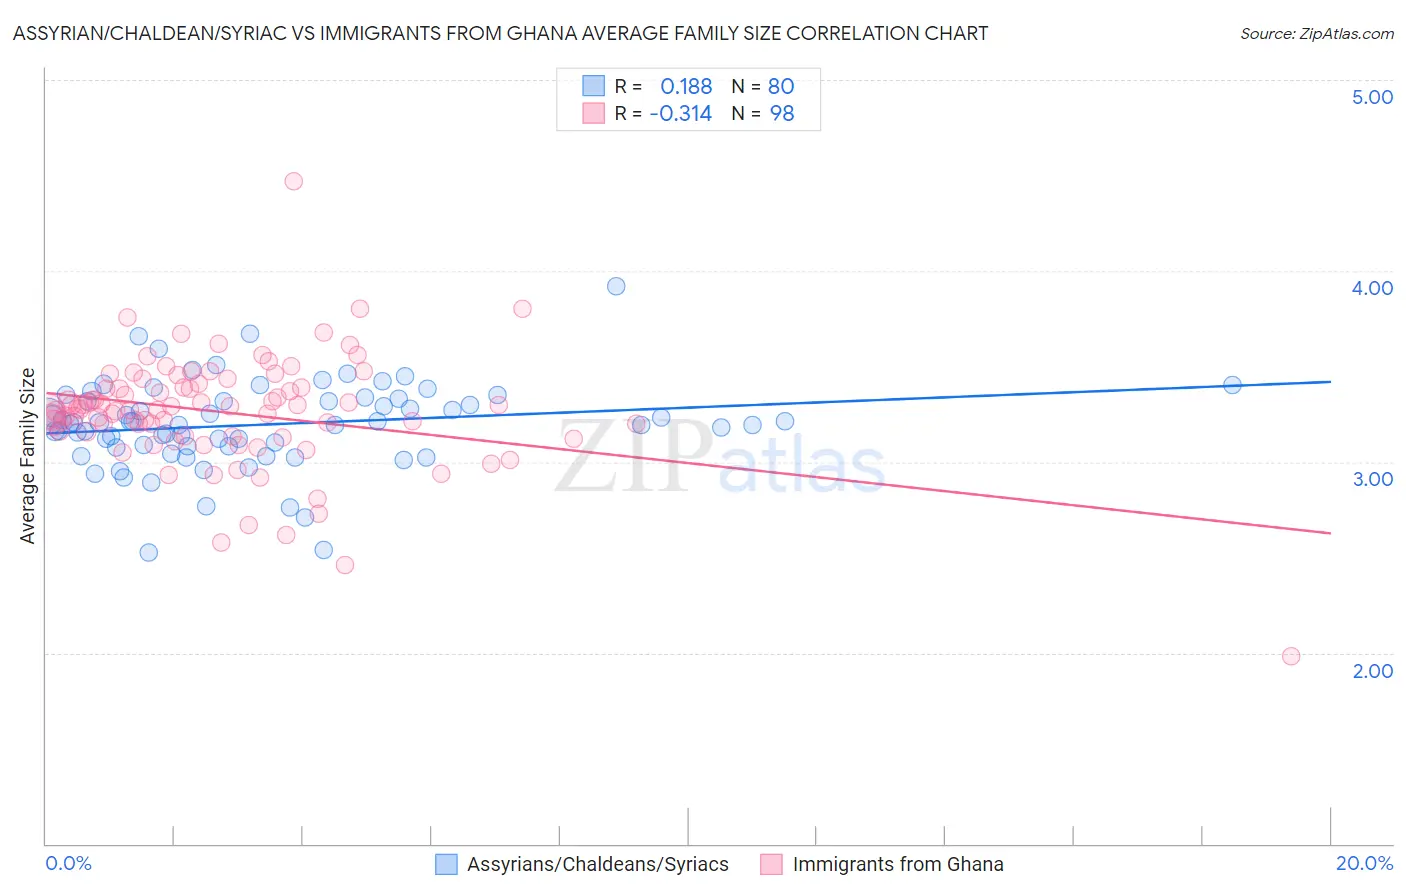
Assyrian/Chaldean/Syriac vs Immigrants from Ghana Average Family Size Correlation Chart
The statistical analysis conducted on geographies consisting of 110,294,582 people shows a poor positive correlation between the proportion of Assyrians/Chaldeans/Syriacs and average family size in the United States with a correlation coefficient (R) of 0.188 and weighted average of 3.24. Similarly, the statistical analysis conducted on geographies consisting of 199,809,831 people shows a mild negative correlation between the proportion of Immigrants from Ghana and average family size in the United States with a correlation coefficient (R) of -0.314 and weighted average of 3.29, a difference of 1.3%.
Average Family Size Correlation Summary
| Measurement | Assyrian/Chaldean/Syriac | Immigrants from Ghana |
| Minimum | 2.52 | 1.98 |
| Maximum | 3.92 | 4.47 |
| Range | 1.40 | 2.49 |
| Mean | 3.20 | 3.26 |
| Median | 3.20 | 3.27 |
| Interquartile 25% (IQ1) | 3.08 | 3.14 |
| Interquartile 75% (IQ3) | 3.33 | 3.39 |
| Interquartile Range (IQR) | 0.25 | 0.25 |
| Standard Deviation (Sample) | 0.23 | 0.30 |
| Standard Deviation (Population) | 0.23 | 0.30 |
Similar Demographics by Average Family Size
Demographics Similar to Assyrians/Chaldeans/Syriacs by Average Family Size
In terms of average family size, the demographic groups most similar to Assyrians/Chaldeans/Syriacs are Indian (Asian) (3.24, a difference of 0.0%), Jordanian (3.24, a difference of 0.010%), Blackfeet (3.24, a difference of 0.030%), Spanish American (3.24, a difference of 0.030%), and Immigrants from Jordan (3.24, a difference of 0.050%).
| Demographics | Rating | Rank | Average Family Size |
| Liberians | 81.2 /100 | #142 | Excellent 3.25 |
| Bhutanese | 81.0 /100 | #143 | Excellent 3.25 |
| Tsimshian | 80.2 /100 | #144 | Excellent 3.25 |
| Armenians | 78.2 /100 | #145 | Good 3.25 |
| Immigrants | Africa | 77.9 /100 | #146 | Good 3.25 |
| Immigrants | Jordan | 75.7 /100 | #147 | Good 3.24 |
| Blackfeet | 75.0 /100 | #148 | Good 3.24 |
| Assyrians/Chaldeans/Syriacs | 73.8 /100 | #149 | Good 3.24 |
| Indians (Asian) | 73.6 /100 | #150 | Good 3.24 |
| Jordanians | 73.5 /100 | #151 | Good 3.24 |
| Spanish Americans | 72.5 /100 | #152 | Good 3.24 |
| Immigrants | Eritrea | 71.4 /100 | #153 | Good 3.24 |
| Immigrants | Egypt | 70.0 /100 | #154 | Good 3.24 |
| Seminole | 68.2 /100 | #155 | Good 3.24 |
| Immigrants | Taiwan | 68.1 /100 | #156 | Good 3.24 |
Demographics Similar to Immigrants from Ghana by Average Family Size
In terms of average family size, the demographic groups most similar to Immigrants from Ghana are Paiute (3.29, a difference of 0.020%), Ghanaian (3.29, a difference of 0.030%), Bolivian (3.29, a difference of 0.050%), Immigrants from Western Africa (3.29, a difference of 0.090%), and West Indian (3.29, a difference of 0.12%).
| Demographics | Rating | Rank | Average Family Size |
| Barbadians | 98.6 /100 | #98 | Exceptional 3.29 |
| Nigerians | 98.6 /100 | #99 | Exceptional 3.29 |
| Guamanians/Chamorros | 98.6 /100 | #100 | Exceptional 3.29 |
| Immigrants | Burma/Myanmar | 98.6 /100 | #101 | Exceptional 3.29 |
| West Indians | 98.5 /100 | #102 | Exceptional 3.29 |
| Immigrants | Western Africa | 98.4 /100 | #103 | Exceptional 3.29 |
| Bolivians | 98.3 /100 | #104 | Exceptional 3.29 |
| Immigrants | Ghana | 98.1 /100 | #105 | Exceptional 3.29 |
| Paiute | 98.0 /100 | #106 | Exceptional 3.29 |
| Ghanaians | 98.0 /100 | #107 | Exceptional 3.29 |
| Asians | 97.0 /100 | #108 | Exceptional 3.28 |
| Puerto Ricans | 96.7 /100 | #109 | Exceptional 3.28 |
| Bahamians | 96.6 /100 | #110 | Exceptional 3.28 |
| Indonesians | 96.2 /100 | #111 | Exceptional 3.28 |
| Blacks/African Americans | 95.7 /100 | #112 | Exceptional 3.27 |