English vs Immigrants from Ghana Average Family Size
COMPARE
English
Immigrants from Ghana
Average Family Size
Average Family Size Comparison
English
Immigrants from Ghana
3.11
AVERAGE FAMILY SIZE
0.0/ 100
METRIC RATING
325th/ 347
METRIC RANK
3.29
AVERAGE FAMILY SIZE
98.1/ 100
METRIC RATING
105th/ 347
METRIC RANK
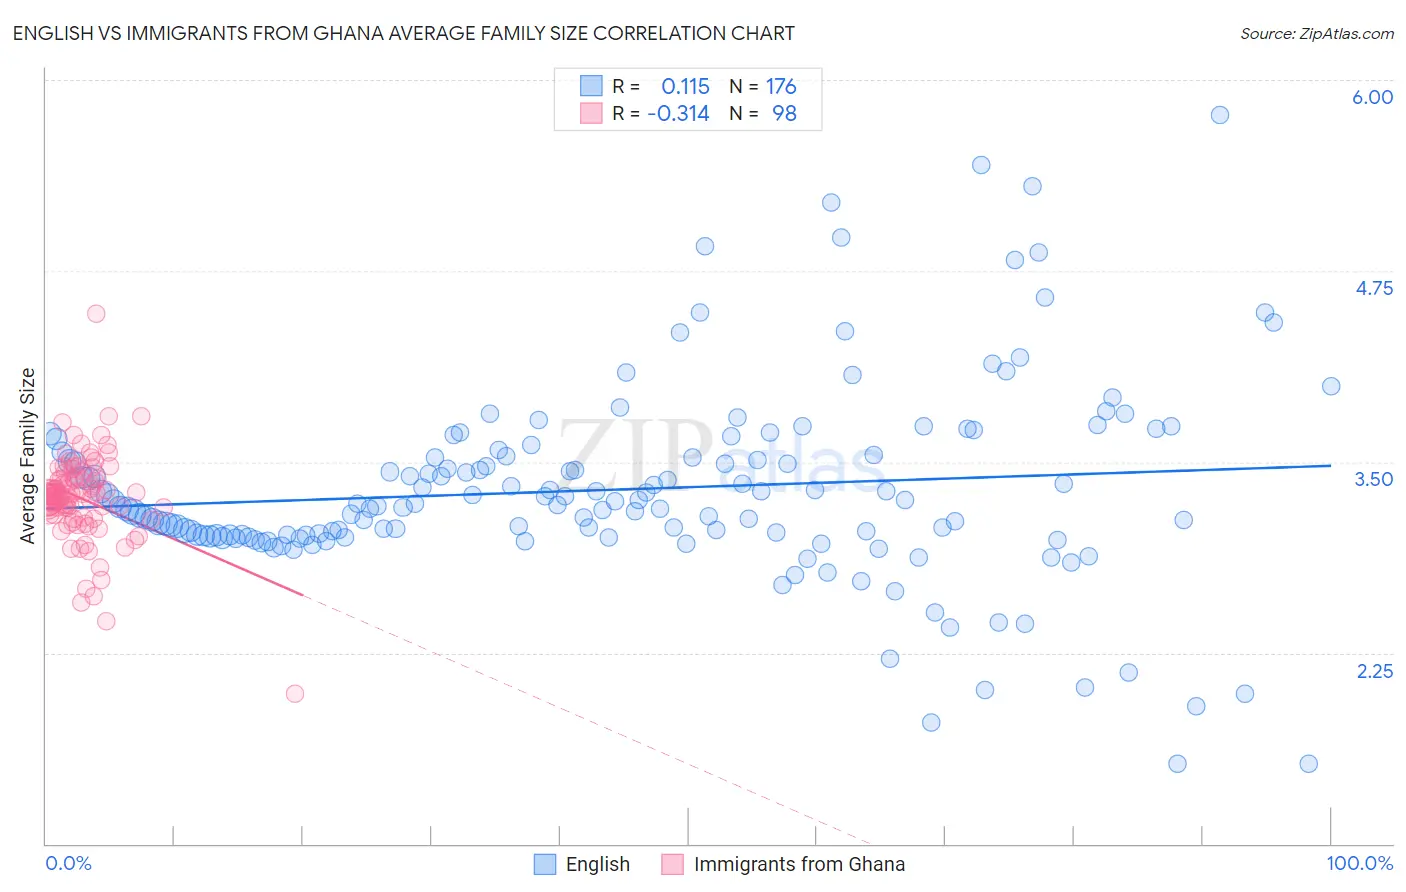
English vs Immigrants from Ghana Average Family Size Correlation Chart
The statistical analysis conducted on geographies consisting of 579,316,351 people shows a poor positive correlation between the proportion of English and average family size in the United States with a correlation coefficient (R) of 0.115 and weighted average of 3.11. Similarly, the statistical analysis conducted on geographies consisting of 199,809,831 people shows a mild negative correlation between the proportion of Immigrants from Ghana and average family size in the United States with a correlation coefficient (R) of -0.314 and weighted average of 3.29, a difference of 5.6%.
Average Family Size Correlation Summary
| Measurement | English | Immigrants from Ghana |
| Minimum | 1.52 | 1.98 |
| Maximum | 5.77 | 4.47 |
| Range | 4.25 | 2.49 |
| Mean | 3.32 | 3.26 |
| Median | 3.22 | 3.27 |
| Interquartile 25% (IQ1) | 3.02 | 3.14 |
| Interquartile 75% (IQ3) | 3.54 | 3.39 |
| Interquartile Range (IQR) | 0.52 | 0.25 |
| Standard Deviation (Sample) | 0.64 | 0.30 |
| Standard Deviation (Population) | 0.64 | 0.30 |
Similar Demographics by Average Family Size
Demographics Similar to English by Average Family Size
In terms of average family size, the demographic groups most similar to English are Celtic (3.11, a difference of 0.040%), Ottawa (3.11, a difference of 0.050%), Dutch (3.11, a difference of 0.060%), Czech (3.11, a difference of 0.060%), and Soviet Union (3.11, a difference of 0.12%).
| Demographics | Rating | Rank | Average Family Size |
| Eastern Europeans | 0.1 /100 | #318 | Tragic 3.12 |
| Welsh | 0.1 /100 | #319 | Tragic 3.12 |
| Immigrants | North America | 0.0 /100 | #320 | Tragic 3.12 |
| Immigrants | Austria | 0.0 /100 | #321 | Tragic 3.12 |
| Immigrants | Canada | 0.0 /100 | #322 | Tragic 3.12 |
| Soviet Union | 0.0 /100 | #323 | Tragic 3.11 |
| Celtics | 0.0 /100 | #324 | Tragic 3.11 |
| English | 0.0 /100 | #325 | Tragic 3.11 |
| Ottawa | 0.0 /100 | #326 | Tragic 3.11 |
| Dutch | 0.0 /100 | #327 | Tragic 3.11 |
| Czechs | 0.0 /100 | #328 | Tragic 3.11 |
| Belgians | 0.0 /100 | #329 | Tragic 3.11 |
| Latvians | 0.0 /100 | #330 | Tragic 3.11 |
| Scotch-Irish | 0.0 /100 | #331 | Tragic 3.11 |
| Scottish | 0.0 /100 | #332 | Tragic 3.11 |
Demographics Similar to Immigrants from Ghana by Average Family Size
In terms of average family size, the demographic groups most similar to Immigrants from Ghana are Paiute (3.29, a difference of 0.020%), Ghanaian (3.29, a difference of 0.030%), Bolivian (3.29, a difference of 0.050%), Immigrants from Western Africa (3.29, a difference of 0.090%), and West Indian (3.29, a difference of 0.12%).
| Demographics | Rating | Rank | Average Family Size |
| Barbadians | 98.6 /100 | #98 | Exceptional 3.29 |
| Nigerians | 98.6 /100 | #99 | Exceptional 3.29 |
| Guamanians/Chamorros | 98.6 /100 | #100 | Exceptional 3.29 |
| Immigrants | Burma/Myanmar | 98.6 /100 | #101 | Exceptional 3.29 |
| West Indians | 98.5 /100 | #102 | Exceptional 3.29 |
| Immigrants | Western Africa | 98.4 /100 | #103 | Exceptional 3.29 |
| Bolivians | 98.3 /100 | #104 | Exceptional 3.29 |
| Immigrants | Ghana | 98.1 /100 | #105 | Exceptional 3.29 |
| Paiute | 98.0 /100 | #106 | Exceptional 3.29 |
| Ghanaians | 98.0 /100 | #107 | Exceptional 3.29 |
| Asians | 97.0 /100 | #108 | Exceptional 3.28 |
| Puerto Ricans | 96.7 /100 | #109 | Exceptional 3.28 |
| Bahamians | 96.6 /100 | #110 | Exceptional 3.28 |
| Indonesians | 96.2 /100 | #111 | Exceptional 3.28 |
| Blacks/African Americans | 95.7 /100 | #112 | Exceptional 3.27 |