Alaskan Athabascan vs Immigrants from Ghana Average Family Size
COMPARE
Alaskan Athabascan
Immigrants from Ghana
Average Family Size
Average Family Size Comparison
Alaskan Athabascans
Immigrants from Ghana
3.27
AVERAGE FAMILY SIZE
92.4/ 100
METRIC RATING
123rd/ 347
METRIC RANK
3.29
AVERAGE FAMILY SIZE
98.1/ 100
METRIC RATING
105th/ 347
METRIC RANK
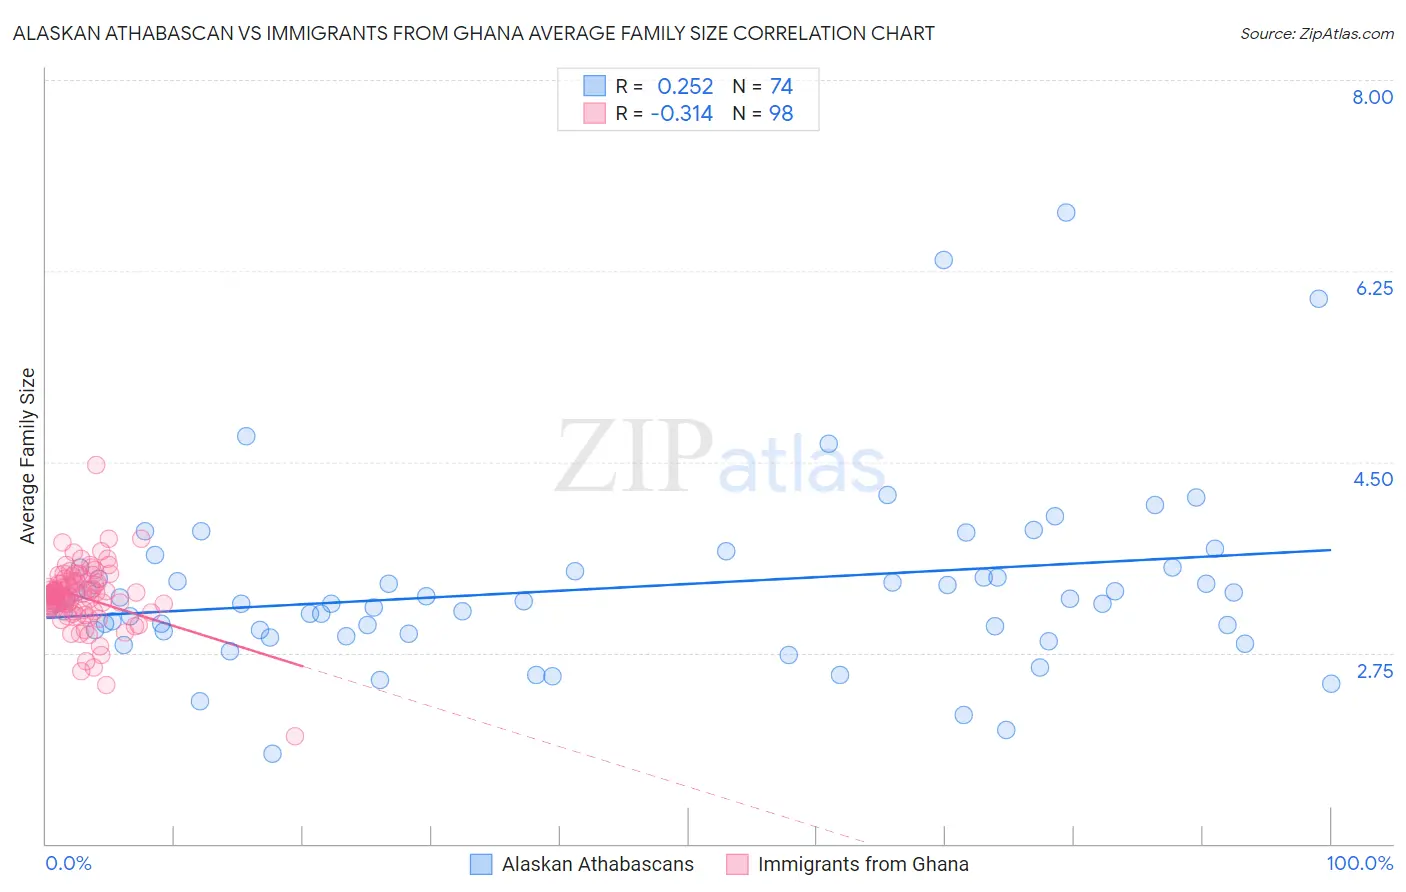
Alaskan Athabascan vs Immigrants from Ghana Average Family Size Correlation Chart
The statistical analysis conducted on geographies consisting of 45,814,644 people shows a weak positive correlation between the proportion of Alaskan Athabascans and average family size in the United States with a correlation coefficient (R) of 0.252 and weighted average of 3.27. Similarly, the statistical analysis conducted on geographies consisting of 199,809,831 people shows a mild negative correlation between the proportion of Immigrants from Ghana and average family size in the United States with a correlation coefficient (R) of -0.314 and weighted average of 3.29, a difference of 0.65%.
Average Family Size Correlation Summary
| Measurement | Alaskan Athabascan | Immigrants from Ghana |
| Minimum | 1.83 | 1.98 |
| Maximum | 6.79 | 4.47 |
| Range | 4.96 | 2.49 |
| Mean | 3.34 | 3.26 |
| Median | 3.21 | 3.27 |
| Interquartile 25% (IQ1) | 2.95 | 3.14 |
| Interquartile 75% (IQ3) | 3.50 | 3.39 |
| Interquartile Range (IQR) | 0.55 | 0.25 |
| Standard Deviation (Sample) | 0.82 | 0.30 |
| Standard Deviation (Population) | 0.82 | 0.30 |
Demographics Similar to Alaskan Athabascans and Immigrants from Ghana by Average Family Size
In terms of average family size, the demographic groups most similar to Alaskan Athabascans are Immigrants from Colombia (3.27, a difference of 0.020%), South American Indian (3.26, a difference of 0.050%), Immigrants from Thailand (3.27, a difference of 0.060%), Immigrants from Bahamas (3.27, a difference of 0.080%), and Immigrants from Indonesia (3.27, a difference of 0.090%). Similarly, the demographic groups most similar to Immigrants from Ghana are Paiute (3.29, a difference of 0.020%), Ghanaian (3.29, a difference of 0.030%), Bolivian (3.29, a difference of 0.050%), Asian (3.28, a difference of 0.21%), and Puerto Rican (3.28, a difference of 0.25%).
| Demographics | Rating | Rank | Average Family Size |
| Bolivians | 98.3 /100 | #104 | Exceptional 3.29 |
| Immigrants | Ghana | 98.1 /100 | #105 | Exceptional 3.29 |
| Paiute | 98.0 /100 | #106 | Exceptional 3.29 |
| Ghanaians | 98.0 /100 | #107 | Exceptional 3.29 |
| Asians | 97.0 /100 | #108 | Exceptional 3.28 |
| Puerto Ricans | 96.7 /100 | #109 | Exceptional 3.28 |
| Bahamians | 96.6 /100 | #110 | Exceptional 3.28 |
| Indonesians | 96.2 /100 | #111 | Exceptional 3.28 |
| Blacks/African Americans | 95.7 /100 | #112 | Exceptional 3.27 |
| Immigrants | Panama | 95.6 /100 | #113 | Exceptional 3.27 |
| South Americans | 95.1 /100 | #114 | Exceptional 3.27 |
| Immigrants | Liberia | 95.0 /100 | #115 | Exceptional 3.27 |
| Immigrants | South America | 95.0 /100 | #116 | Exceptional 3.27 |
| Kiowa | 94.8 /100 | #117 | Exceptional 3.27 |
| Immigrants | Asia | 94.0 /100 | #118 | Exceptional 3.27 |
| Immigrants | Indonesia | 93.7 /100 | #119 | Exceptional 3.27 |
| Immigrants | Bahamas | 93.6 /100 | #120 | Exceptional 3.27 |
| Immigrants | Thailand | 93.3 /100 | #121 | Exceptional 3.27 |
| Immigrants | Colombia | 92.8 /100 | #122 | Exceptional 3.27 |
| Alaskan Athabascans | 92.4 /100 | #123 | Exceptional 3.27 |
| South American Indians | 91.6 /100 | #124 | Exceptional 3.26 |