Austrian vs Immigrants from Eastern Europe Family Households
COMPARE
Austrian
Immigrants from Eastern Europe
Family Households
Family Households Comparison
Austrians
Immigrants from Eastern Europe
64.5%
FAMILY HOUSEHOLDS
68.5/ 100
METRIC RATING
154th/ 347
METRIC RANK
64.0%
FAMILY HOUSEHOLDS
17.2/ 100
METRIC RATING
201st/ 347
METRIC RANK
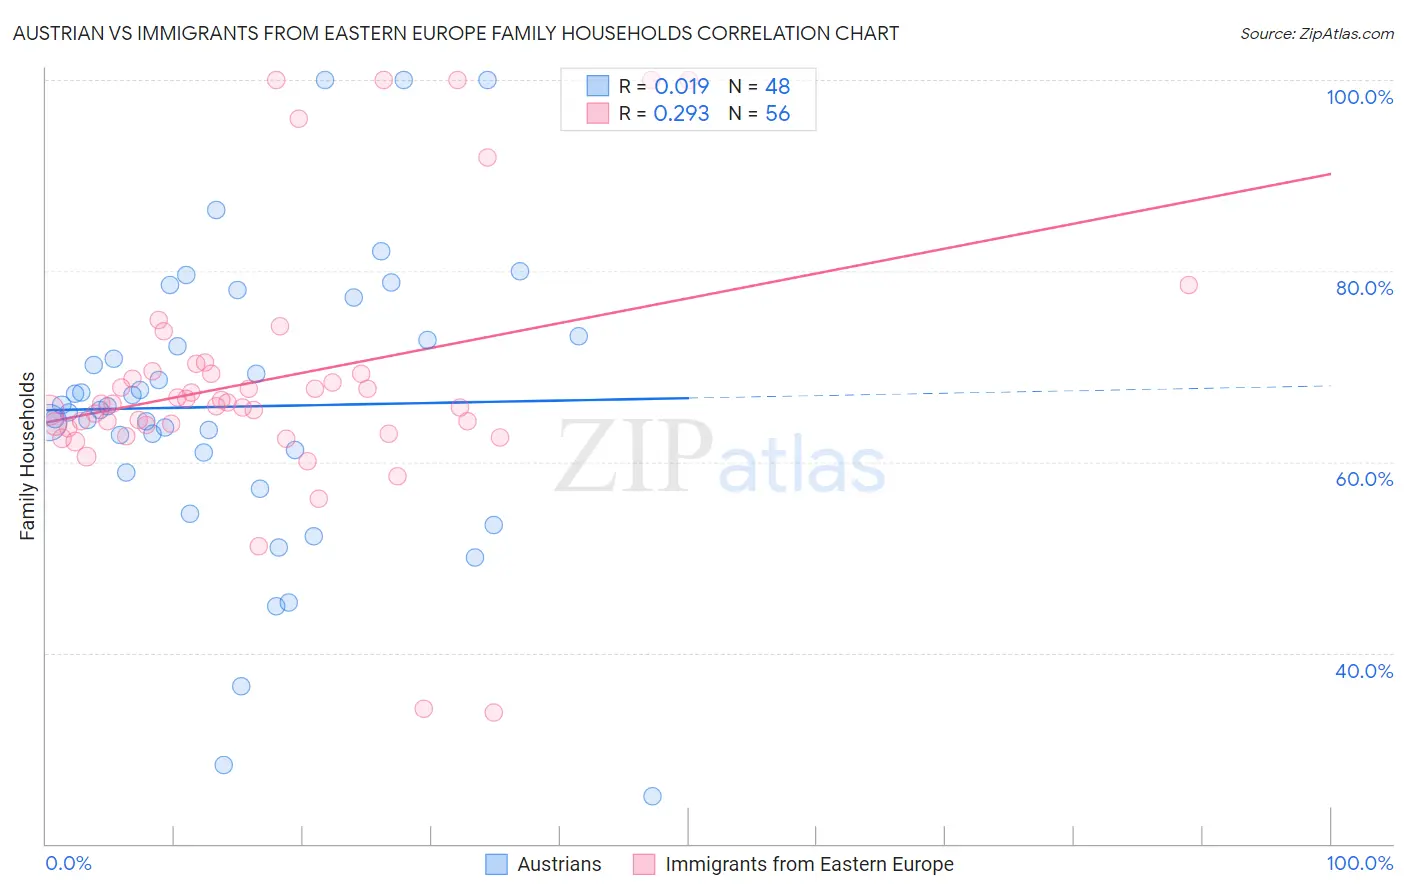
Austrian vs Immigrants from Eastern Europe Family Households Correlation Chart
The statistical analysis conducted on geographies consisting of 451,810,725 people shows no correlation between the proportion of Austrians and percentage of family households in the United States with a correlation coefficient (R) of 0.019 and weighted average of 64.5%. Similarly, the statistical analysis conducted on geographies consisting of 475,514,263 people shows a weak positive correlation between the proportion of Immigrants from Eastern Europe and percentage of family households in the United States with a correlation coefficient (R) of 0.293 and weighted average of 64.0%, a difference of 0.79%.
Family Households Correlation Summary
| Measurement | Austrian | Immigrants from Eastern Europe |
| Minimum | 25.0% | 33.7% |
| Maximum | 100.0% | 100.0% |
| Range | 75.0% | 66.3% |
| Mean | 65.8% | 68.7% |
| Median | 65.7% | 66.2% |
| Interquartile 25% (IQ1) | 60.0% | 63.7% |
| Interquartile 75% (IQ3) | 72.9% | 69.4% |
| Interquartile Range (IQR) | 13.0% | 5.7% |
| Standard Deviation (Sample) | 15.5% | 13.5% |
| Standard Deviation (Population) | 15.4% | 13.4% |
Similar Demographics by Family Households
Demographics Similar to Austrians by Family Households
In terms of family households, the demographic groups most similar to Austrians are Uruguayan (64.5%, a difference of 0.010%), Swedish (64.5%, a difference of 0.020%), Czech (64.5%, a difference of 0.020%), Canadian (64.4%, a difference of 0.030%), and Lebanese (64.4%, a difference of 0.030%).
| Demographics | Rating | Rank | Family Households |
| Immigrants | Chile | 76.5 /100 | #147 | Good 64.6% |
| Delaware | 76.3 /100 | #148 | Good 64.6% |
| Sioux | 76.3 /100 | #149 | Good 64.6% |
| Romanians | 75.3 /100 | #150 | Good 64.5% |
| Syrians | 75.2 /100 | #151 | Good 64.5% |
| Scottish | 70.9 /100 | #152 | Good 64.5% |
| Swedes | 69.8 /100 | #153 | Good 64.5% |
| Austrians | 68.5 /100 | #154 | Good 64.5% |
| Uruguayans | 67.7 /100 | #155 | Good 64.5% |
| Czechs | 67.0 /100 | #156 | Good 64.5% |
| Canadians | 66.6 /100 | #157 | Good 64.4% |
| Lebanese | 66.4 /100 | #158 | Good 64.4% |
| Germans | 65.8 /100 | #159 | Good 64.4% |
| Immigrants | Moldova | 65.2 /100 | #160 | Good 64.4% |
| Immigrants | England | 62.6 /100 | #161 | Good 64.4% |
Demographics Similar to Immigrants from Eastern Europe by Family Households
In terms of family households, the demographic groups most similar to Immigrants from Eastern Europe are Immigrants from Malaysia (64.0%, a difference of 0.020%), Slavic (64.0%, a difference of 0.030%), Immigrants from Canada (64.0%, a difference of 0.040%), Seminole (64.0%, a difference of 0.040%), and Polish (64.0%, a difference of 0.040%).
| Demographics | Rating | Rank | Family Households |
| Paiute | 22.2 /100 | #194 | Fair 64.0% |
| Immigrants | North America | 20.0 /100 | #195 | Poor 64.0% |
| Immigrants | Canada | 19.2 /100 | #196 | Poor 64.0% |
| Seminole | 18.9 /100 | #197 | Poor 64.0% |
| Poles | 18.9 /100 | #198 | Poor 64.0% |
| Slavs | 18.6 /100 | #199 | Poor 64.0% |
| Immigrants | Malaysia | 17.9 /100 | #200 | Poor 64.0% |
| Immigrants | Eastern Europe | 17.2 /100 | #201 | Poor 64.0% |
| Iranians | 13.5 /100 | #202 | Poor 63.9% |
| Norwegians | 13.2 /100 | #203 | Poor 63.9% |
| Immigrants | Uruguay | 12.8 /100 | #204 | Poor 63.9% |
| Brazilians | 12.4 /100 | #205 | Poor 63.9% |
| Immigrants | Lithuania | 12.1 /100 | #206 | Poor 63.9% |
| Nigerians | 11.5 /100 | #207 | Poor 63.9% |
| Immigrants | Bangladesh | 11.4 /100 | #208 | Poor 63.9% |