Austrian vs Immigrants from Kenya Family Households
COMPARE
Austrian
Immigrants from Kenya
Family Households
Family Households Comparison
Austrians
Immigrants from Kenya
64.5%
FAMILY HOUSEHOLDS
68.5/ 100
METRIC RATING
154th/ 347
METRIC RANK
62.3%
FAMILY HOUSEHOLDS
0.0/ 100
METRIC RATING
302nd/ 347
METRIC RANK
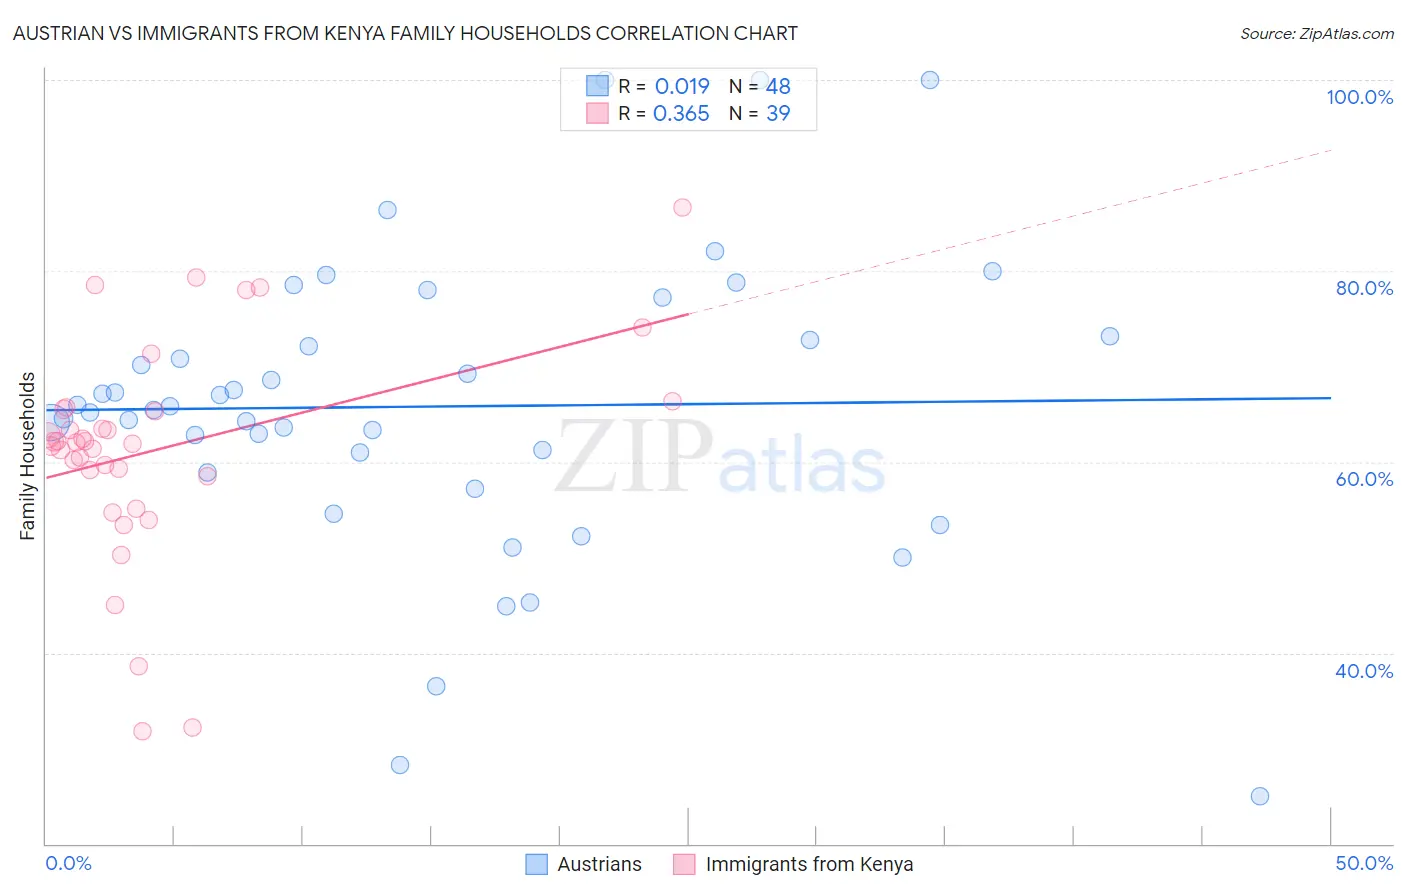
Austrian vs Immigrants from Kenya Family Households Correlation Chart
The statistical analysis conducted on geographies consisting of 451,810,725 people shows no correlation between the proportion of Austrians and percentage of family households in the United States with a correlation coefficient (R) of 0.019 and weighted average of 64.5%. Similarly, the statistical analysis conducted on geographies consisting of 217,999,239 people shows a mild positive correlation between the proportion of Immigrants from Kenya and percentage of family households in the United States with a correlation coefficient (R) of 0.365 and weighted average of 62.3%, a difference of 3.4%.
Family Households Correlation Summary
| Measurement | Austrian | Immigrants from Kenya |
| Minimum | 25.0% | 31.8% |
| Maximum | 100.0% | 86.7% |
| Range | 75.0% | 54.9% |
| Mean | 65.8% | 61.3% |
| Median | 65.7% | 62.0% |
| Interquartile 25% (IQ1) | 60.0% | 58.5% |
| Interquartile 75% (IQ3) | 72.9% | 65.5% |
| Interquartile Range (IQR) | 13.0% | 7.0% |
| Standard Deviation (Sample) | 15.5% | 11.5% |
| Standard Deviation (Population) | 15.4% | 11.4% |
Similar Demographics by Family Households
Demographics Similar to Austrians by Family Households
In terms of family households, the demographic groups most similar to Austrians are Uruguayan (64.5%, a difference of 0.010%), Swedish (64.5%, a difference of 0.020%), Czech (64.5%, a difference of 0.020%), Canadian (64.4%, a difference of 0.030%), and Lebanese (64.4%, a difference of 0.030%).
| Demographics | Rating | Rank | Family Households |
| Immigrants | Chile | 76.5 /100 | #147 | Good 64.6% |
| Delaware | 76.3 /100 | #148 | Good 64.6% |
| Sioux | 76.3 /100 | #149 | Good 64.6% |
| Romanians | 75.3 /100 | #150 | Good 64.5% |
| Syrians | 75.2 /100 | #151 | Good 64.5% |
| Scottish | 70.9 /100 | #152 | Good 64.5% |
| Swedes | 69.8 /100 | #153 | Good 64.5% |
| Austrians | 68.5 /100 | #154 | Good 64.5% |
| Uruguayans | 67.7 /100 | #155 | Good 64.5% |
| Czechs | 67.0 /100 | #156 | Good 64.5% |
| Canadians | 66.6 /100 | #157 | Good 64.4% |
| Lebanese | 66.4 /100 | #158 | Good 64.4% |
| Germans | 65.8 /100 | #159 | Good 64.4% |
| Immigrants | Moldova | 65.2 /100 | #160 | Good 64.4% |
| Immigrants | England | 62.6 /100 | #161 | Good 64.4% |
Demographics Similar to Immigrants from Kenya by Family Households
In terms of family households, the demographic groups most similar to Immigrants from Kenya are Immigrants from Albania (62.4%, a difference of 0.040%), Immigrants from Africa (62.4%, a difference of 0.060%), Cree (62.3%, a difference of 0.060%), Immigrants from Kuwait (62.4%, a difference of 0.070%), and Immigrants from Spain (62.4%, a difference of 0.13%).
| Demographics | Rating | Rank | Family Households |
| Okinawans | 0.0 /100 | #295 | Tragic 62.5% |
| Slovenes | 0.0 /100 | #296 | Tragic 62.4% |
| French American Indians | 0.0 /100 | #297 | Tragic 62.4% |
| Immigrants | Spain | 0.0 /100 | #298 | Tragic 62.4% |
| Immigrants | Kuwait | 0.0 /100 | #299 | Tragic 62.4% |
| Immigrants | Africa | 0.0 /100 | #300 | Tragic 62.4% |
| Immigrants | Albania | 0.0 /100 | #301 | Tragic 62.4% |
| Immigrants | Kenya | 0.0 /100 | #302 | Tragic 62.3% |
| Cree | 0.0 /100 | #303 | Tragic 62.3% |
| Iroquois | 0.0 /100 | #304 | Tragic 62.2% |
| Bermudans | 0.0 /100 | #305 | Tragic 62.2% |
| Africans | 0.0 /100 | #306 | Tragic 62.1% |
| Immigrants | Norway | 0.0 /100 | #307 | Tragic 62.1% |
| Chippewa | 0.0 /100 | #308 | Tragic 62.1% |
| Sub-Saharan Africans | 0.0 /100 | #309 | Tragic 62.1% |