Austrian vs Immigrants from Eastern Europe Householder Income Ages 25 - 44 years
COMPARE
Austrian
Immigrants from Eastern Europe
Householder Income Ages 25 - 44 years
Householder Income Ages 25 - 44 years Comparison
Austrians
Immigrants from Eastern Europe
$101,842
HOUSEHOLDER INCOME AGES 25 - 44 YEARS
98.3/ 100
METRIC RATING
97th/ 347
METRIC RANK
$104,662
HOUSEHOLDER INCOME AGES 25 - 44 YEARS
99.6/ 100
METRIC RATING
68th/ 347
METRIC RANK
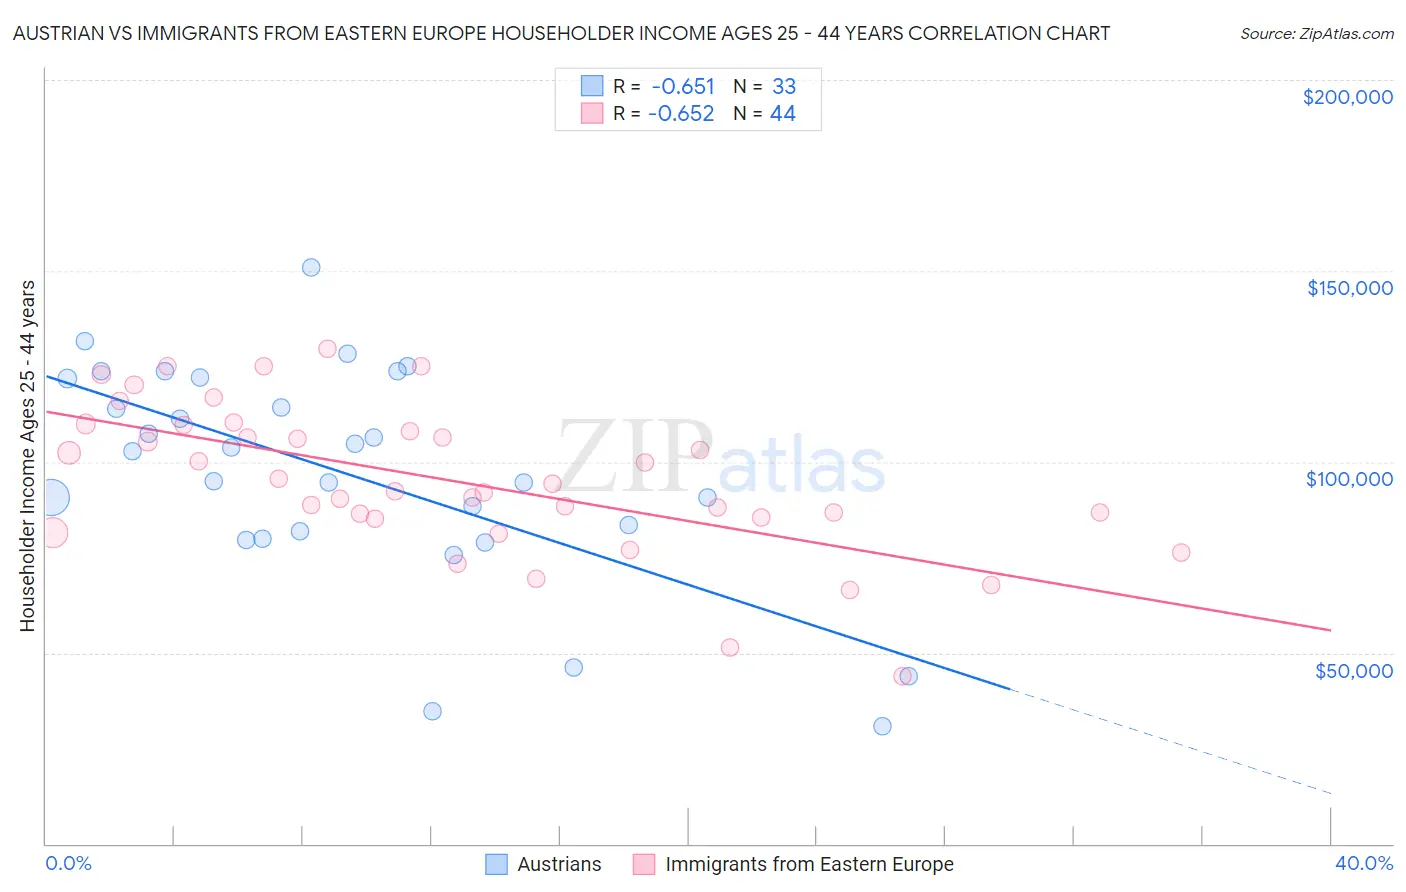
Austrian vs Immigrants from Eastern Europe Householder Income Ages 25 - 44 years Correlation Chart
The statistical analysis conducted on geographies consisting of 450,333,214 people shows a significant negative correlation between the proportion of Austrians and household income with householder between the ages 25 and 44 in the United States with a correlation coefficient (R) of -0.651 and weighted average of $101,842. Similarly, the statistical analysis conducted on geographies consisting of 473,985,258 people shows a significant negative correlation between the proportion of Immigrants from Eastern Europe and household income with householder between the ages 25 and 44 in the United States with a correlation coefficient (R) of -0.652 and weighted average of $104,662, a difference of 2.8%.
Householder Income Ages 25 - 44 years Correlation Summary
| Measurement | Austrian | Immigrants from Eastern Europe |
| Minimum | $30,750 | $43,724 |
| Maximum | $150,833 | $129,765 |
| Range | $120,083 | $86,041 |
| Mean | $97,065 | $95,165 |
| Median | $102,890 | $93,230 |
| Interquartile 25% (IQ1) | $80,830 | $85,360 |
| Interquartile 75% (IQ3) | $121,881 | $108,718 |
| Interquartile Range (IQR) | $41,051 | $23,358 |
| Standard Deviation (Sample) | $28,521 | $19,648 |
| Standard Deviation (Population) | $28,086 | $19,424 |
Similar Demographics by Householder Income Ages 25 - 44 years
Demographics Similar to Austrians by Householder Income Ages 25 - 44 years
In terms of householder income ages 25 - 44 years, the demographic groups most similar to Austrians are Macedonian ($101,882, a difference of 0.040%), Assyrian/Chaldean/Syriac ($101,936, a difference of 0.090%), Immigrants from Kazakhstan ($101,727, a difference of 0.11%), Sri Lankan ($101,960, a difference of 0.12%), and Immigrants from England ($102,020, a difference of 0.17%).
| Demographics | Rating | Rank | Householder Income Ages 25 - 44 years |
| Ukrainians | 98.8 /100 | #90 | Exceptional $102,451 |
| Croatians | 98.7 /100 | #91 | Exceptional $102,414 |
| Immigrants | North America | 98.7 /100 | #92 | Exceptional $102,407 |
| Immigrants | England | 98.4 /100 | #93 | Exceptional $102,020 |
| Sri Lankans | 98.4 /100 | #94 | Exceptional $101,960 |
| Assyrians/Chaldeans/Syriacs | 98.3 /100 | #95 | Exceptional $101,936 |
| Macedonians | 98.3 /100 | #96 | Exceptional $101,882 |
| Austrians | 98.3 /100 | #97 | Exceptional $101,842 |
| Immigrants | Kazakhstan | 98.1 /100 | #98 | Exceptional $101,727 |
| Taiwanese | 97.9 /100 | #99 | Exceptional $101,492 |
| Immigrants | Argentina | 97.8 /100 | #100 | Exceptional $101,415 |
| Albanians | 97.8 /100 | #101 | Exceptional $101,367 |
| Immigrants | Lebanon | 97.4 /100 | #102 | Exceptional $101,124 |
| Immigrants | Moldova | 97.4 /100 | #103 | Exceptional $101,091 |
| Immigrants | Poland | 97.4 /100 | #104 | Exceptional $101,065 |
Demographics Similar to Immigrants from Eastern Europe by Householder Income Ages 25 - 44 years
In terms of householder income ages 25 - 44 years, the demographic groups most similar to Immigrants from Eastern Europe are Immigrants from Romania ($104,713, a difference of 0.050%), Mongolian ($104,578, a difference of 0.080%), Immigrants from Croatia ($104,503, a difference of 0.15%), Afghan ($104,410, a difference of 0.24%), and Laotian ($104,993, a difference of 0.32%).
| Demographics | Rating | Rank | Householder Income Ages 25 - 44 years |
| Lithuanians | 99.7 /100 | #61 | Exceptional $105,223 |
| Immigrants | Italy | 99.7 /100 | #62 | Exceptional $105,201 |
| Immigrants | Scotland | 99.7 /100 | #63 | Exceptional $105,089 |
| New Zealanders | 99.7 /100 | #64 | Exceptional $105,085 |
| Immigrants | Netherlands | 99.7 /100 | #65 | Exceptional $105,082 |
| Laotians | 99.7 /100 | #66 | Exceptional $104,993 |
| Immigrants | Romania | 99.6 /100 | #67 | Exceptional $104,713 |
| Immigrants | Eastern Europe | 99.6 /100 | #68 | Exceptional $104,662 |
| Mongolians | 99.6 /100 | #69 | Exceptional $104,578 |
| Immigrants | Croatia | 99.6 /100 | #70 | Exceptional $104,503 |
| Afghans | 99.6 /100 | #71 | Exceptional $104,410 |
| Chinese | 99.5 /100 | #72 | Exceptional $104,264 |
| Italians | 99.5 /100 | #73 | Exceptional $104,215 |
| Immigrants | Fiji | 99.5 /100 | #74 | Exceptional $103,954 |
| Koreans | 99.4 /100 | #75 | Exceptional $103,824 |