Austrian vs Salvadoran Family Households
COMPARE
Austrian
Salvadoran
Family Households
Family Households Comparison
Austrians
Salvadorans
64.5%
FAMILY HOUSEHOLDS
68.5/ 100
METRIC RATING
154th/ 347
METRIC RANK
67.2%
FAMILY HOUSEHOLDS
100.0/ 100
METRIC RATING
33rd/ 347
METRIC RANK
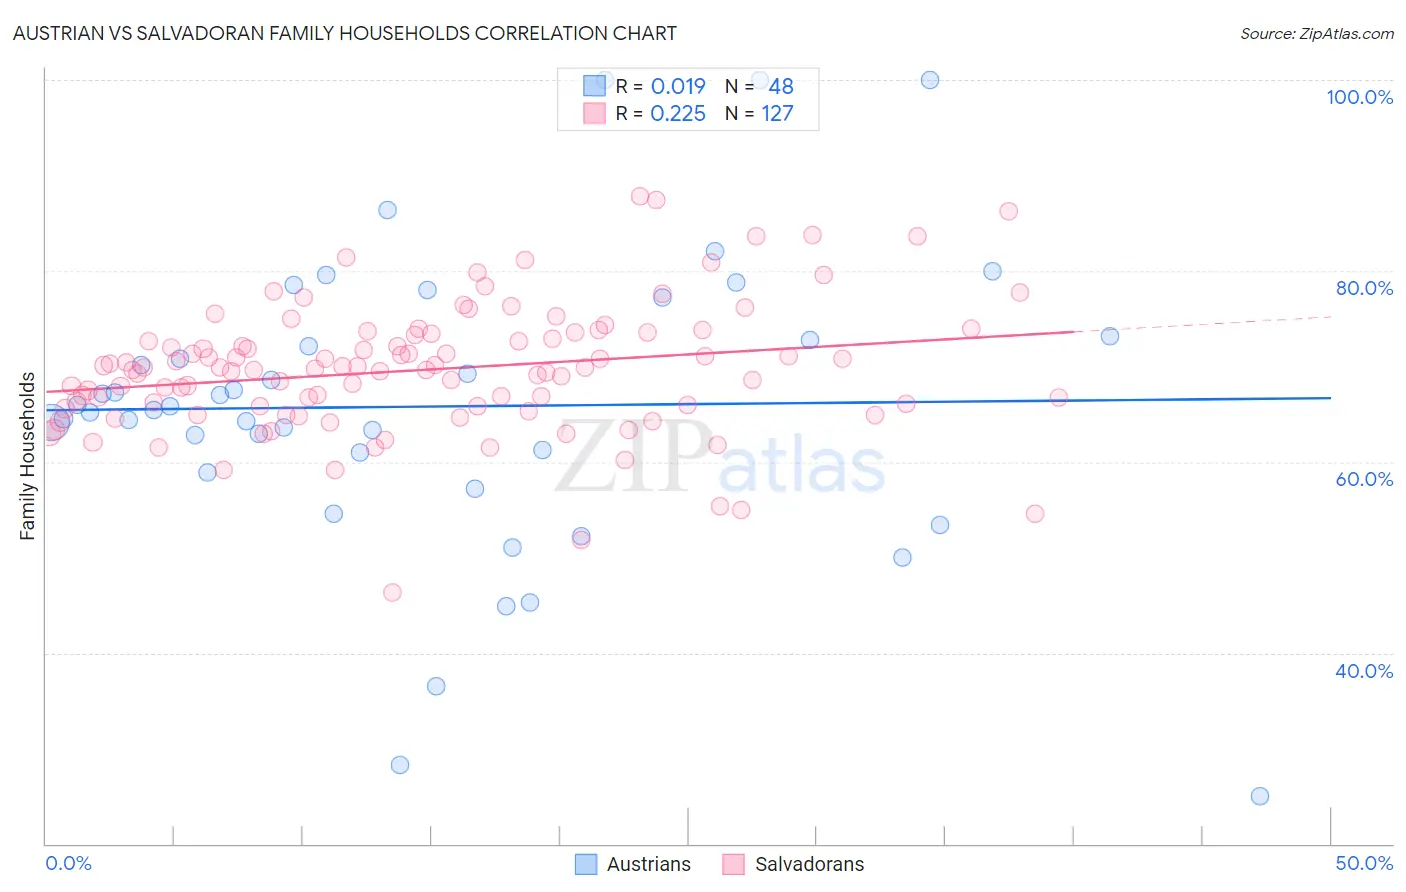
Austrian vs Salvadoran Family Households Correlation Chart
The statistical analysis conducted on geographies consisting of 451,810,725 people shows no correlation between the proportion of Austrians and percentage of family households in the United States with a correlation coefficient (R) of 0.019 and weighted average of 64.5%. Similarly, the statistical analysis conducted on geographies consisting of 398,699,924 people shows a weak positive correlation between the proportion of Salvadorans and percentage of family households in the United States with a correlation coefficient (R) of 0.225 and weighted average of 67.2%, a difference of 4.2%.
Family Households Correlation Summary
| Measurement | Austrian | Salvadoran |
| Minimum | 25.0% | 46.4% |
| Maximum | 100.0% | 87.9% |
| Range | 75.0% | 41.5% |
| Mean | 65.8% | 69.7% |
| Median | 65.7% | 69.8% |
| Interquartile 25% (IQ1) | 60.0% | 65.8% |
| Interquartile 75% (IQ3) | 72.9% | 73.5% |
| Interquartile Range (IQR) | 13.0% | 7.6% |
| Standard Deviation (Sample) | 15.5% | 6.8% |
| Standard Deviation (Population) | 15.4% | 6.8% |
Similar Demographics by Family Households
Demographics Similar to Austrians by Family Households
In terms of family households, the demographic groups most similar to Austrians are Uruguayan (64.5%, a difference of 0.010%), Swedish (64.5%, a difference of 0.020%), Czech (64.5%, a difference of 0.020%), Canadian (64.4%, a difference of 0.030%), and Lebanese (64.4%, a difference of 0.030%).
| Demographics | Rating | Rank | Family Households |
| Immigrants | Chile | 76.5 /100 | #147 | Good 64.6% |
| Delaware | 76.3 /100 | #148 | Good 64.6% |
| Sioux | 76.3 /100 | #149 | Good 64.6% |
| Romanians | 75.3 /100 | #150 | Good 64.5% |
| Syrians | 75.2 /100 | #151 | Good 64.5% |
| Scottish | 70.9 /100 | #152 | Good 64.5% |
| Swedes | 69.8 /100 | #153 | Good 64.5% |
| Austrians | 68.5 /100 | #154 | Good 64.5% |
| Uruguayans | 67.7 /100 | #155 | Good 64.5% |
| Czechs | 67.0 /100 | #156 | Good 64.5% |
| Canadians | 66.6 /100 | #157 | Good 64.4% |
| Lebanese | 66.4 /100 | #158 | Good 64.4% |
| Germans | 65.8 /100 | #159 | Good 64.4% |
| Immigrants | Moldova | 65.2 /100 | #160 | Good 64.4% |
| Immigrants | England | 62.6 /100 | #161 | Good 64.4% |
Demographics Similar to Salvadorans by Family Households
In terms of family households, the demographic groups most similar to Salvadorans are Thai (67.2%, a difference of 0.0%), Nepalese (67.2%, a difference of 0.040%), Tohono O'odham (67.1%, a difference of 0.050%), Peruvian (67.1%, a difference of 0.060%), and Immigrants from Latin America (67.2%, a difference of 0.10%).
| Demographics | Rating | Rank | Family Households |
| Immigrants | India | 100.0 /100 | #26 | Exceptional 67.4% |
| Hispanics or Latinos | 100.0 /100 | #27 | Exceptional 67.4% |
| Hawaiians | 100.0 /100 | #28 | Exceptional 67.4% |
| Nicaraguans | 100.0 /100 | #29 | Exceptional 67.4% |
| Immigrants | Peru | 100.0 /100 | #30 | Exceptional 67.2% |
| Immigrants | Latin America | 100.0 /100 | #31 | Exceptional 67.2% |
| Nepalese | 100.0 /100 | #32 | Exceptional 67.2% |
| Salvadorans | 100.0 /100 | #33 | Exceptional 67.2% |
| Thais | 100.0 /100 | #34 | Exceptional 67.2% |
| Tohono O'odham | 100.0 /100 | #35 | Exceptional 67.1% |
| Peruvians | 100.0 /100 | #36 | Exceptional 67.1% |
| Tsimshian | 100.0 /100 | #37 | Exceptional 67.1% |
| Mexican American Indians | 100.0 /100 | #38 | Exceptional 67.0% |
| Immigrants | El Salvador | 100.0 /100 | #39 | Exceptional 67.0% |
| Guamanians/Chamorros | 100.0 /100 | #40 | Exceptional 66.6% |