Austrian vs Immigrants from Belize Family Households
COMPARE
Austrian
Immigrants from Belize
Family Households
Family Households Comparison
Austrians
Immigrants from Belize
64.5%
FAMILY HOUSEHOLDS
68.5/ 100
METRIC RATING
154th/ 347
METRIC RANK
64.9%
FAMILY HOUSEHOLDS
92.7/ 100
METRIC RATING
125th/ 347
METRIC RANK
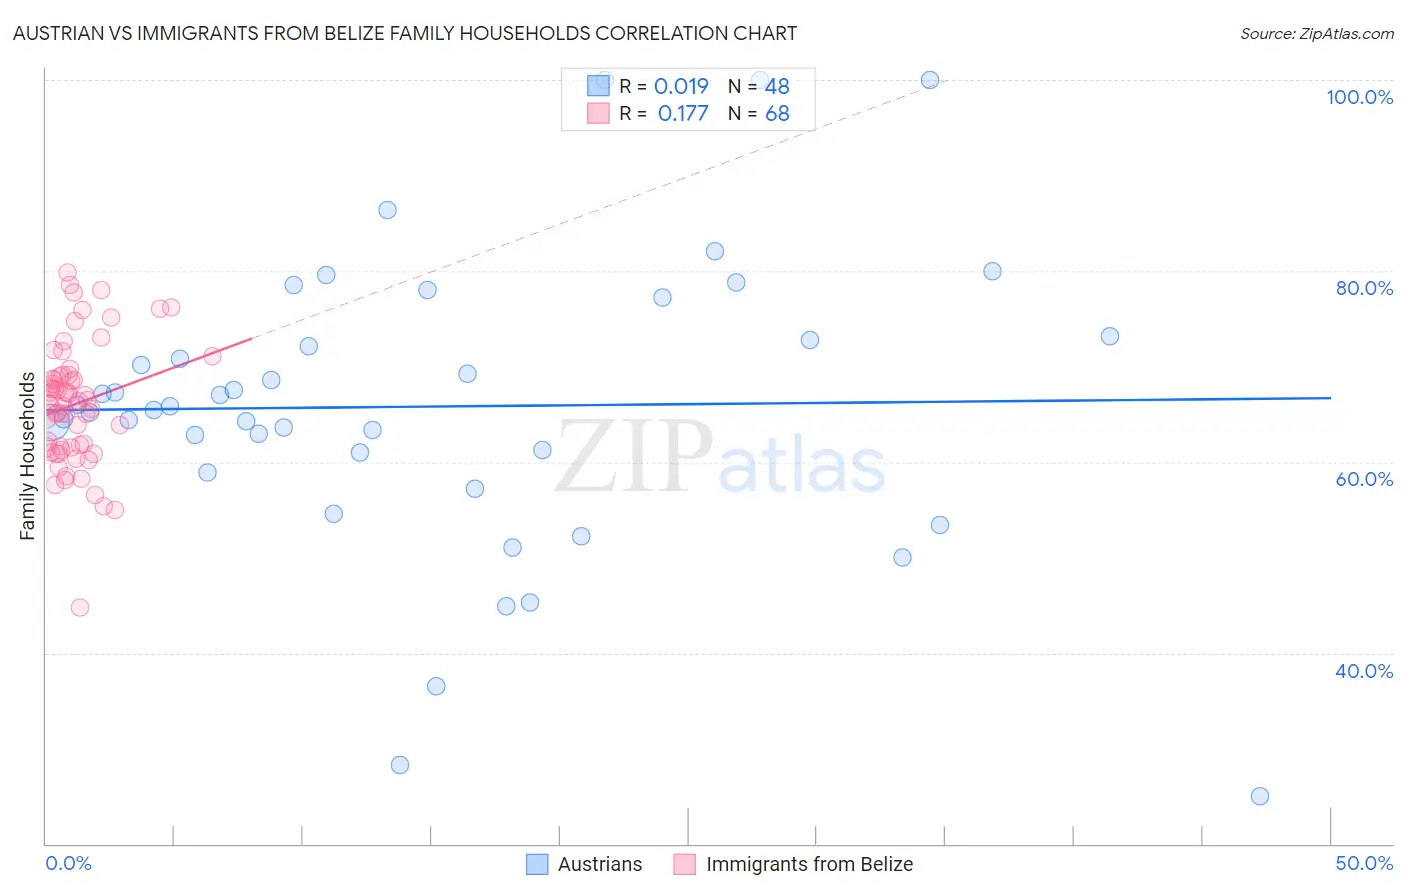
Austrian vs Immigrants from Belize Family Households Correlation Chart
The statistical analysis conducted on geographies consisting of 451,810,725 people shows no correlation between the proportion of Austrians and percentage of family households in the United States with a correlation coefficient (R) of 0.019 and weighted average of 64.5%. Similarly, the statistical analysis conducted on geographies consisting of 130,284,292 people shows a poor positive correlation between the proportion of Immigrants from Belize and percentage of family households in the United States with a correlation coefficient (R) of 0.177 and weighted average of 64.9%, a difference of 0.59%.
Family Households Correlation Summary
| Measurement | Austrian | Immigrants from Belize |
| Minimum | 25.0% | 44.8% |
| Maximum | 100.0% | 79.8% |
| Range | 75.0% | 35.1% |
| Mean | 65.8% | 66.0% |
| Median | 65.7% | 66.2% |
| Interquartile 25% (IQ1) | 60.0% | 61.5% |
| Interquartile 75% (IQ3) | 72.9% | 69.1% |
| Interquartile Range (IQR) | 13.0% | 7.5% |
| Standard Deviation (Sample) | 15.5% | 6.4% |
| Standard Deviation (Population) | 15.4% | 6.4% |
Similar Demographics by Family Households
Demographics Similar to Austrians by Family Households
In terms of family households, the demographic groups most similar to Austrians are Uruguayan (64.5%, a difference of 0.010%), Swedish (64.5%, a difference of 0.020%), Czech (64.5%, a difference of 0.020%), Canadian (64.4%, a difference of 0.030%), and Lebanese (64.4%, a difference of 0.030%).
| Demographics | Rating | Rank | Family Households |
| Immigrants | Chile | 76.5 /100 | #147 | Good 64.6% |
| Delaware | 76.3 /100 | #148 | Good 64.6% |
| Sioux | 76.3 /100 | #149 | Good 64.6% |
| Romanians | 75.3 /100 | #150 | Good 64.5% |
| Syrians | 75.2 /100 | #151 | Good 64.5% |
| Scottish | 70.9 /100 | #152 | Good 64.5% |
| Swedes | 69.8 /100 | #153 | Good 64.5% |
| Austrians | 68.5 /100 | #154 | Good 64.5% |
| Uruguayans | 67.7 /100 | #155 | Good 64.5% |
| Czechs | 67.0 /100 | #156 | Good 64.5% |
| Canadians | 66.6 /100 | #157 | Good 64.4% |
| Lebanese | 66.4 /100 | #158 | Good 64.4% |
| Germans | 65.8 /100 | #159 | Good 64.4% |
| Immigrants | Moldova | 65.2 /100 | #160 | Good 64.4% |
| Immigrants | England | 62.6 /100 | #161 | Good 64.4% |
Demographics Similar to Immigrants from Belize by Family Households
In terms of family households, the demographic groups most similar to Immigrants from Belize are Immigrants from Argentina (64.9%, a difference of 0.010%), Panamanian (64.8%, a difference of 0.020%), Hmong (64.9%, a difference of 0.030%), Choctaw (64.9%, a difference of 0.030%), and Immigrants from Panama (64.8%, a difference of 0.030%).
| Demographics | Rating | Rank | Family Households |
| Dutch | 95.1 /100 | #118 | Exceptional 64.9% |
| Immigrants | Eastern Asia | 94.4 /100 | #119 | Exceptional 64.9% |
| Immigrants | Oceania | 94.2 /100 | #120 | Exceptional 64.9% |
| Hungarians | 94.0 /100 | #121 | Exceptional 64.9% |
| Hmong | 93.4 /100 | #122 | Exceptional 64.9% |
| Choctaw | 93.4 /100 | #123 | Exceptional 64.9% |
| Immigrants | Argentina | 92.8 /100 | #124 | Exceptional 64.9% |
| Immigrants | Belize | 92.7 /100 | #125 | Exceptional 64.9% |
| Panamanians | 92.4 /100 | #126 | Exceptional 64.8% |
| Immigrants | Panama | 92.0 /100 | #127 | Exceptional 64.8% |
| Italians | 91.9 /100 | #128 | Exceptional 64.8% |
| Immigrants | Ecuador | 91.4 /100 | #129 | Exceptional 64.8% |
| Immigrants | Italy | 90.2 /100 | #130 | Exceptional 64.8% |
| Immigrants | Nonimmigrants | 90.1 /100 | #131 | Exceptional 64.8% |
| Cajuns | 89.4 /100 | #132 | Excellent 64.8% |