British vs Immigrants from Eastern Europe Family Households
COMPARE
British
Immigrants from Eastern Europe
Family Households
Family Households Comparison
British
Immigrants from Eastern Europe
64.4%
FAMILY HOUSEHOLDS
61.6/ 100
METRIC RATING
162nd/ 347
METRIC RANK
64.0%
FAMILY HOUSEHOLDS
17.2/ 100
METRIC RATING
201st/ 347
METRIC RANK
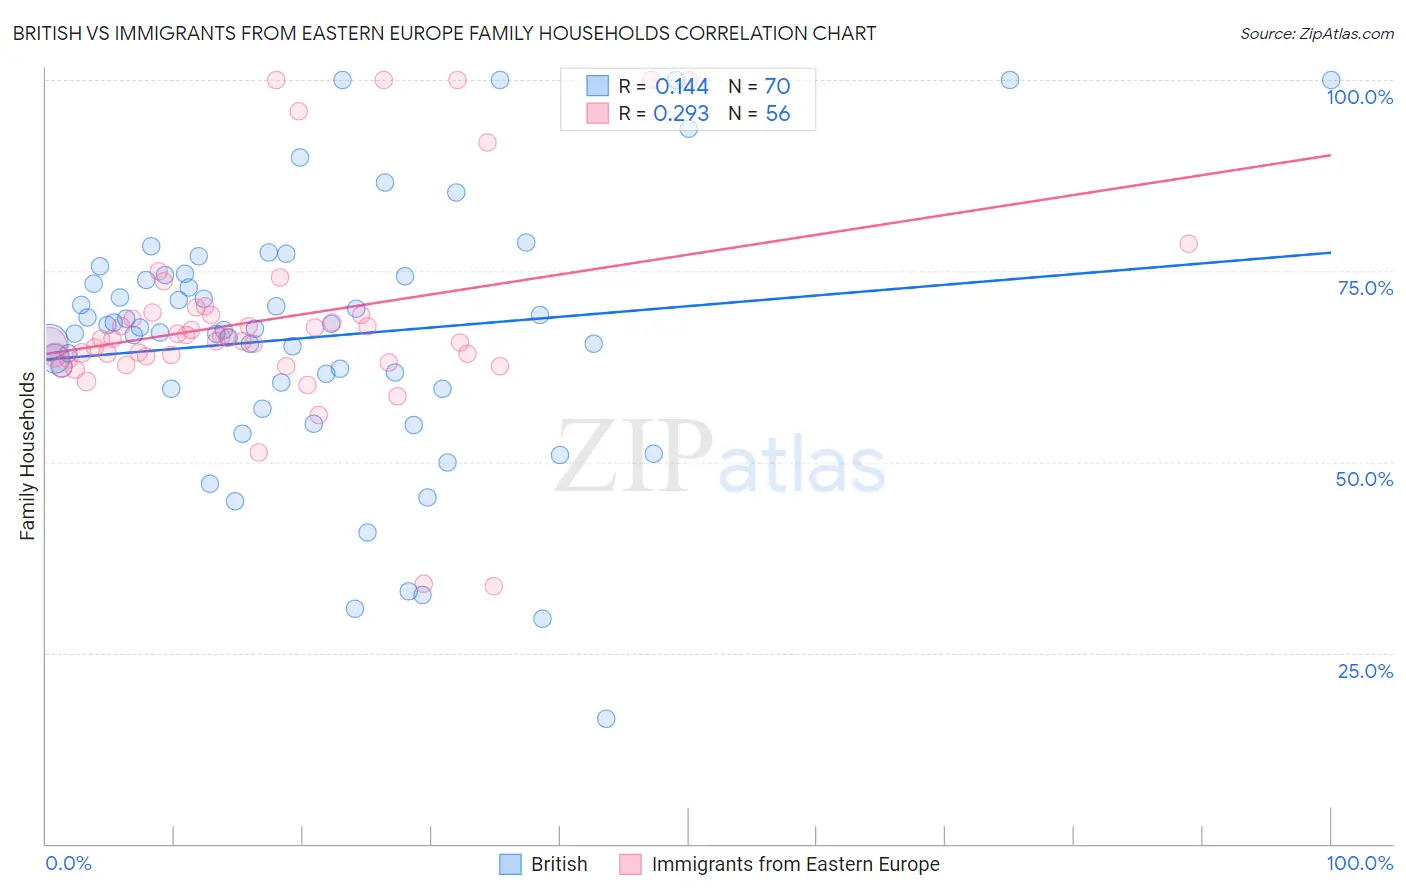
British vs Immigrants from Eastern Europe Family Households Correlation Chart
The statistical analysis conducted on geographies consisting of 531,009,478 people shows a poor positive correlation between the proportion of British and percentage of family households in the United States with a correlation coefficient (R) of 0.144 and weighted average of 64.4%. Similarly, the statistical analysis conducted on geographies consisting of 475,514,263 people shows a weak positive correlation between the proportion of Immigrants from Eastern Europe and percentage of family households in the United States with a correlation coefficient (R) of 0.293 and weighted average of 64.0%, a difference of 0.69%.
Family Households Correlation Summary
| Measurement | British | Immigrants from Eastern Europe |
| Minimum | 16.4% | 33.7% |
| Maximum | 100.0% | 100.0% |
| Range | 83.6% | 66.3% |
| Mean | 66.4% | 68.7% |
| Median | 67.4% | 66.2% |
| Interquartile 25% (IQ1) | 59.6% | 63.7% |
| Interquartile 75% (IQ3) | 74.3% | 69.4% |
| Interquartile Range (IQR) | 14.8% | 5.7% |
| Standard Deviation (Sample) | 16.9% | 13.5% |
| Standard Deviation (Population) | 16.8% | 13.4% |
Similar Demographics by Family Households
Demographics Similar to British by Family Households
In terms of family households, the demographic groups most similar to British are Chickasaw (64.4%, a difference of 0.0%), Immigrants from England (64.4%, a difference of 0.010%), Immigrants from Nigeria (64.4%, a difference of 0.020%), Immigrants from Southern Europe (64.4%, a difference of 0.020%), and Scotch-Irish (64.4%, a difference of 0.030%).
| Demographics | Rating | Rank | Family Households |
| Uruguayans | 67.7 /100 | #155 | Good 64.5% |
| Czechs | 67.0 /100 | #156 | Good 64.5% |
| Canadians | 66.6 /100 | #157 | Good 64.4% |
| Lebanese | 66.4 /100 | #158 | Good 64.4% |
| Germans | 65.8 /100 | #159 | Good 64.4% |
| Immigrants | Moldova | 65.2 /100 | #160 | Good 64.4% |
| Immigrants | England | 62.6 /100 | #161 | Good 64.4% |
| British | 61.6 /100 | #162 | Good 64.4% |
| Chickasaw | 61.5 /100 | #163 | Good 64.4% |
| Immigrants | Nigeria | 60.1 /100 | #164 | Good 64.4% |
| Immigrants | Southern Europe | 60.0 /100 | #165 | Good 64.4% |
| Scotch-Irish | 59.2 /100 | #166 | Average 64.4% |
| Irish | 57.9 /100 | #167 | Average 64.4% |
| Hondurans | 57.5 /100 | #168 | Average 64.4% |
| Iraqis | 56.0 /100 | #169 | Average 64.4% |
Demographics Similar to Immigrants from Eastern Europe by Family Households
In terms of family households, the demographic groups most similar to Immigrants from Eastern Europe are Immigrants from Malaysia (64.0%, a difference of 0.020%), Slavic (64.0%, a difference of 0.030%), Immigrants from Canada (64.0%, a difference of 0.040%), Seminole (64.0%, a difference of 0.040%), and Polish (64.0%, a difference of 0.040%).
| Demographics | Rating | Rank | Family Households |
| Paiute | 22.2 /100 | #194 | Fair 64.0% |
| Immigrants | North America | 20.0 /100 | #195 | Poor 64.0% |
| Immigrants | Canada | 19.2 /100 | #196 | Poor 64.0% |
| Seminole | 18.9 /100 | #197 | Poor 64.0% |
| Poles | 18.9 /100 | #198 | Poor 64.0% |
| Slavs | 18.6 /100 | #199 | Poor 64.0% |
| Immigrants | Malaysia | 17.9 /100 | #200 | Poor 64.0% |
| Immigrants | Eastern Europe | 17.2 /100 | #201 | Poor 64.0% |
| Iranians | 13.5 /100 | #202 | Poor 63.9% |
| Norwegians | 13.2 /100 | #203 | Poor 63.9% |
| Immigrants | Uruguay | 12.8 /100 | #204 | Poor 63.9% |
| Brazilians | 12.4 /100 | #205 | Poor 63.9% |
| Immigrants | Lithuania | 12.1 /100 | #206 | Poor 63.9% |
| Nigerians | 11.5 /100 | #207 | Poor 63.9% |
| Immigrants | Bangladesh | 11.4 /100 | #208 | Poor 63.9% |