Austrian vs Puerto Rican Family Households
COMPARE
Austrian
Puerto Rican
Family Households
Family Households Comparison
Austrians
Puerto Ricans
64.5%
FAMILY HOUSEHOLDS
68.5/ 100
METRIC RATING
154th/ 347
METRIC RANK
64.2%
FAMILY HOUSEHOLDS
33.4/ 100
METRIC RATING
184th/ 347
METRIC RANK
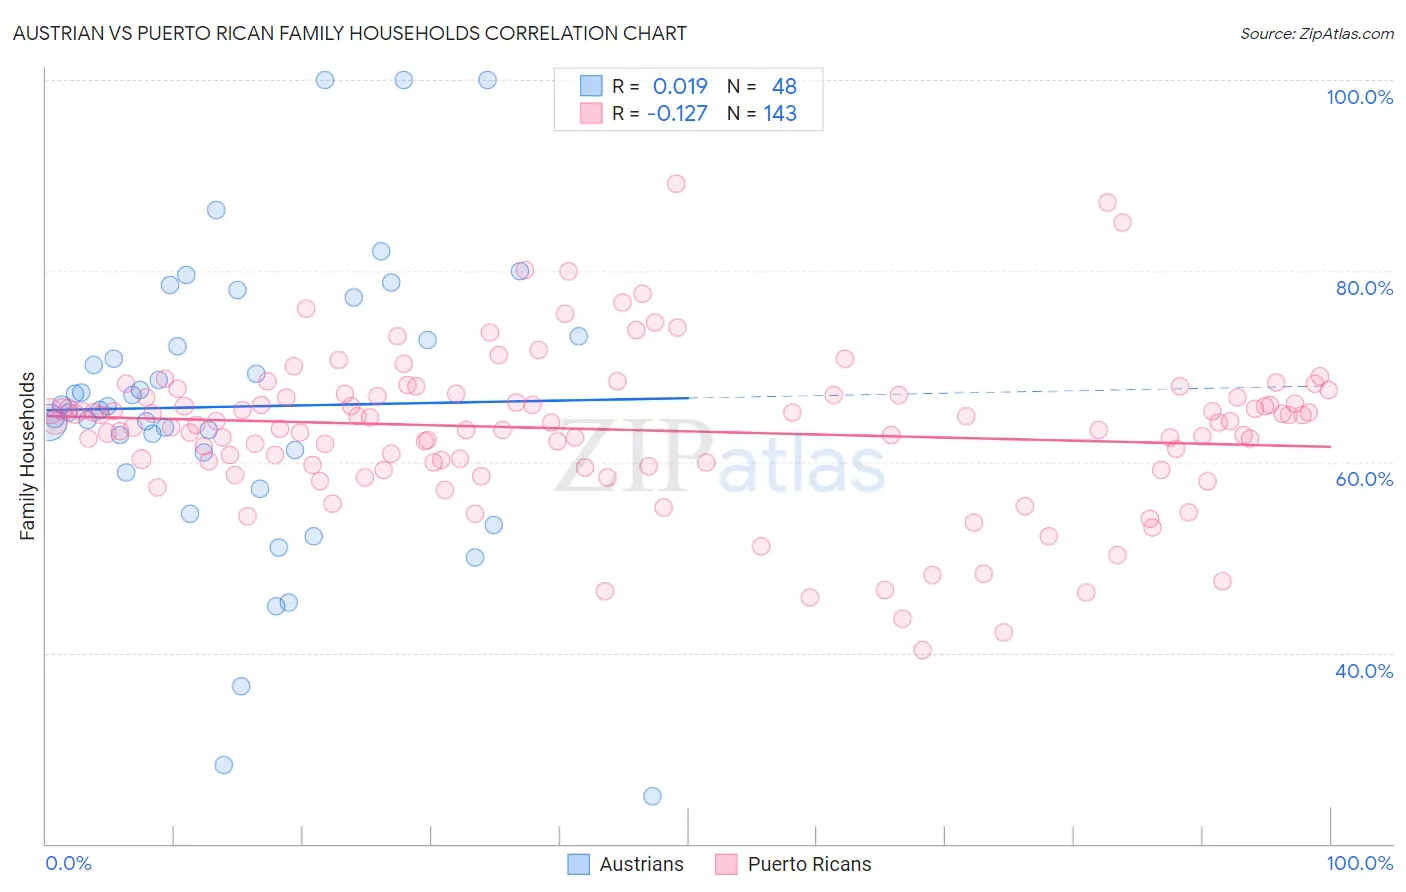
Austrian vs Puerto Rican Family Households Correlation Chart
The statistical analysis conducted on geographies consisting of 451,810,725 people shows no correlation between the proportion of Austrians and percentage of family households in the United States with a correlation coefficient (R) of 0.019 and weighted average of 64.5%. Similarly, the statistical analysis conducted on geographies consisting of 527,724,488 people shows a poor negative correlation between the proportion of Puerto Ricans and percentage of family households in the United States with a correlation coefficient (R) of -0.127 and weighted average of 64.2%, a difference of 0.49%.
Family Households Correlation Summary
| Measurement | Austrian | Puerto Rican |
| Minimum | 25.0% | 40.3% |
| Maximum | 100.0% | 89.2% |
| Range | 75.0% | 48.9% |
| Mean | 65.8% | 63.4% |
| Median | 65.7% | 64.2% |
| Interquartile 25% (IQ1) | 60.0% | 59.9% |
| Interquartile 75% (IQ3) | 72.9% | 67.0% |
| Interquartile Range (IQR) | 13.0% | 7.1% |
| Standard Deviation (Sample) | 15.5% | 8.0% |
| Standard Deviation (Population) | 15.4% | 8.0% |
Similar Demographics by Family Households
Demographics Similar to Austrians by Family Households
In terms of family households, the demographic groups most similar to Austrians are Uruguayan (64.5%, a difference of 0.010%), Swedish (64.5%, a difference of 0.020%), Czech (64.5%, a difference of 0.020%), Canadian (64.4%, a difference of 0.030%), and Lebanese (64.4%, a difference of 0.030%).
| Demographics | Rating | Rank | Family Households |
| Immigrants | Chile | 76.5 /100 | #147 | Good 64.6% |
| Delaware | 76.3 /100 | #148 | Good 64.6% |
| Sioux | 76.3 /100 | #149 | Good 64.6% |
| Romanians | 75.3 /100 | #150 | Good 64.5% |
| Syrians | 75.2 /100 | #151 | Good 64.5% |
| Scottish | 70.9 /100 | #152 | Good 64.5% |
| Swedes | 69.8 /100 | #153 | Good 64.5% |
| Austrians | 68.5 /100 | #154 | Good 64.5% |
| Uruguayans | 67.7 /100 | #155 | Good 64.5% |
| Czechs | 67.0 /100 | #156 | Good 64.5% |
| Canadians | 66.6 /100 | #157 | Good 64.4% |
| Lebanese | 66.4 /100 | #158 | Good 64.4% |
| Germans | 65.8 /100 | #159 | Good 64.4% |
| Immigrants | Moldova | 65.2 /100 | #160 | Good 64.4% |
| Immigrants | England | 62.6 /100 | #161 | Good 64.4% |
Demographics Similar to Puerto Ricans by Family Households
In terms of family households, the demographic groups most similar to Puerto Ricans are Creek (64.2%, a difference of 0.010%), Immigrants from Honduras (64.2%, a difference of 0.020%), Immigrants from Trinidad and Tobago (64.2%, a difference of 0.020%), Ukrainian (64.2%, a difference of 0.020%), and Immigrants from Iran (64.1%, a difference of 0.050%).
| Demographics | Rating | Rank | Family Households |
| Immigrants | Micronesia | 42.3 /100 | #177 | Average 64.2% |
| Jamaicans | 40.6 /100 | #178 | Average 64.2% |
| Immigrants | Ukraine | 38.2 /100 | #179 | Fair 64.2% |
| Immigrants | Honduras | 35.0 /100 | #180 | Fair 64.2% |
| Immigrants | Trinidad and Tobago | 34.9 /100 | #181 | Fair 64.2% |
| Ukrainians | 34.6 /100 | #182 | Fair 64.2% |
| Creek | 34.1 /100 | #183 | Fair 64.2% |
| Puerto Ricans | 33.4 /100 | #184 | Fair 64.2% |
| Immigrants | Iran | 30.4 /100 | #185 | Fair 64.1% |
| Spanish Americans | 30.1 /100 | #186 | Fair 64.1% |
| Northern Europeans | 28.2 /100 | #187 | Fair 64.1% |
| Paraguayans | 26.7 /100 | #188 | Fair 64.1% |
| Immigrants | Western Asia | 25.3 /100 | #189 | Fair 64.1% |
| Zimbabweans | 24.7 /100 | #190 | Fair 64.1% |
| Arabs | 24.5 /100 | #191 | Fair 64.1% |