Austrian vs Uruguayan Family Households
COMPARE
Austrian
Uruguayan
Family Households
Family Households Comparison
Austrians
Uruguayans
64.5%
FAMILY HOUSEHOLDS
68.5/ 100
METRIC RATING
154th/ 347
METRIC RANK
64.5%
FAMILY HOUSEHOLDS
67.7/ 100
METRIC RATING
155th/ 347
METRIC RANK
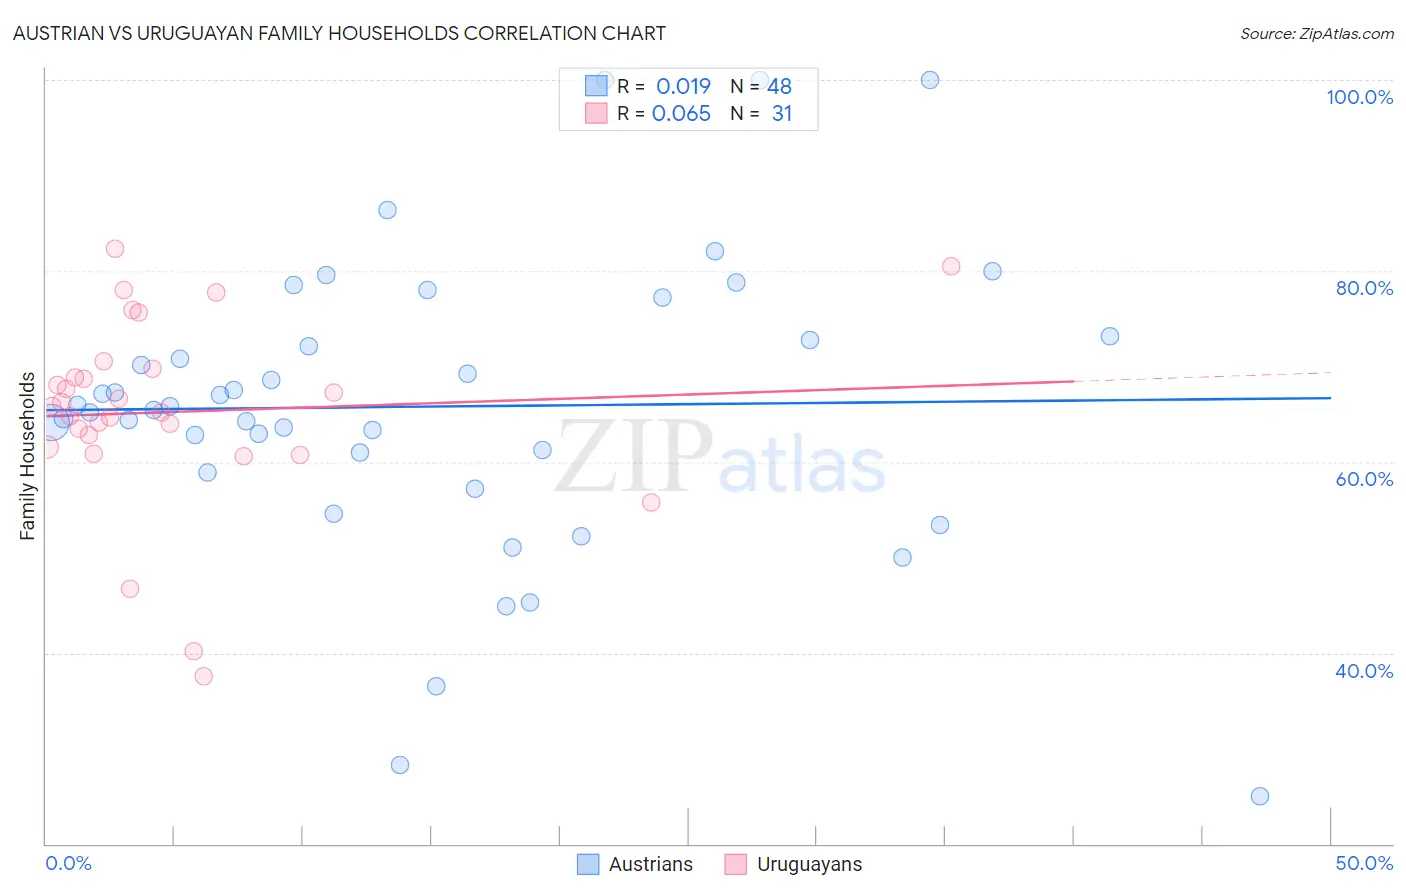
Austrian vs Uruguayan Family Households Correlation Chart
The statistical analysis conducted on geographies consisting of 451,810,725 people shows no correlation between the proportion of Austrians and percentage of family households in the United States with a correlation coefficient (R) of 0.019 and weighted average of 64.5%. Similarly, the statistical analysis conducted on geographies consisting of 144,759,449 people shows a slight positive correlation between the proportion of Uruguayans and percentage of family households in the United States with a correlation coefficient (R) of 0.065 and weighted average of 64.5%, a difference of 0.010%.
Family Households Correlation Summary
| Measurement | Austrian | Uruguayan |
| Minimum | 25.0% | 37.5% |
| Maximum | 100.0% | 82.3% |
| Range | 75.0% | 44.8% |
| Mean | 65.8% | 65.2% |
| Median | 65.7% | 65.8% |
| Interquartile 25% (IQ1) | 60.0% | 61.5% |
| Interquartile 75% (IQ3) | 72.9% | 69.7% |
| Interquartile Range (IQR) | 13.0% | 8.2% |
| Standard Deviation (Sample) | 15.5% | 10.1% |
| Standard Deviation (Population) | 15.4% | 10.0% |
Demographics Similar to Austrians and Uruguayans by Family Households
In terms of family households, the demographic groups most similar to Austrians are Swedish (64.5%, a difference of 0.020%), Czech (64.5%, a difference of 0.020%), Canadian (64.4%, a difference of 0.030%), Lebanese (64.4%, a difference of 0.030%), and Scottish (64.5%, a difference of 0.040%). Similarly, the demographic groups most similar to Uruguayans are Czech (64.5%, a difference of 0.010%), Canadian (64.4%, a difference of 0.020%), Lebanese (64.4%, a difference of 0.020%), Swedish (64.5%, a difference of 0.030%), and German (64.4%, a difference of 0.030%).
| Demographics | Rating | Rank | Family Households |
| South American Indians | 81.9 /100 | #144 | Excellent 64.6% |
| Welsh | 80.1 /100 | #145 | Excellent 64.6% |
| Immigrants | Romania | 77.0 /100 | #146 | Good 64.6% |
| Immigrants | Chile | 76.5 /100 | #147 | Good 64.6% |
| Delaware | 76.3 /100 | #148 | Good 64.6% |
| Sioux | 76.3 /100 | #149 | Good 64.6% |
| Romanians | 75.3 /100 | #150 | Good 64.5% |
| Syrians | 75.2 /100 | #151 | Good 64.5% |
| Scottish | 70.9 /100 | #152 | Good 64.5% |
| Swedes | 69.8 /100 | #153 | Good 64.5% |
| Austrians | 68.5 /100 | #154 | Good 64.5% |
| Uruguayans | 67.7 /100 | #155 | Good 64.5% |
| Czechs | 67.0 /100 | #156 | Good 64.5% |
| Canadians | 66.6 /100 | #157 | Good 64.4% |
| Lebanese | 66.4 /100 | #158 | Good 64.4% |
| Germans | 65.8 /100 | #159 | Good 64.4% |
| Immigrants | Moldova | 65.2 /100 | #160 | Good 64.4% |
| Immigrants | England | 62.6 /100 | #161 | Good 64.4% |
| British | 61.6 /100 | #162 | Good 64.4% |
| Chickasaw | 61.5 /100 | #163 | Good 64.4% |
| Immigrants | Nigeria | 60.1 /100 | #164 | Good 64.4% |