Austrian vs Immigrants from Serbia Family Households
COMPARE
Austrian
Immigrants from Serbia
Family Households
Family Households Comparison
Austrians
Immigrants from Serbia
64.5%
FAMILY HOUSEHOLDS
68.5/ 100
METRIC RATING
154th/ 347
METRIC RANK
61.6%
FAMILY HOUSEHOLDS
0.0/ 100
METRIC RATING
322nd/ 347
METRIC RANK
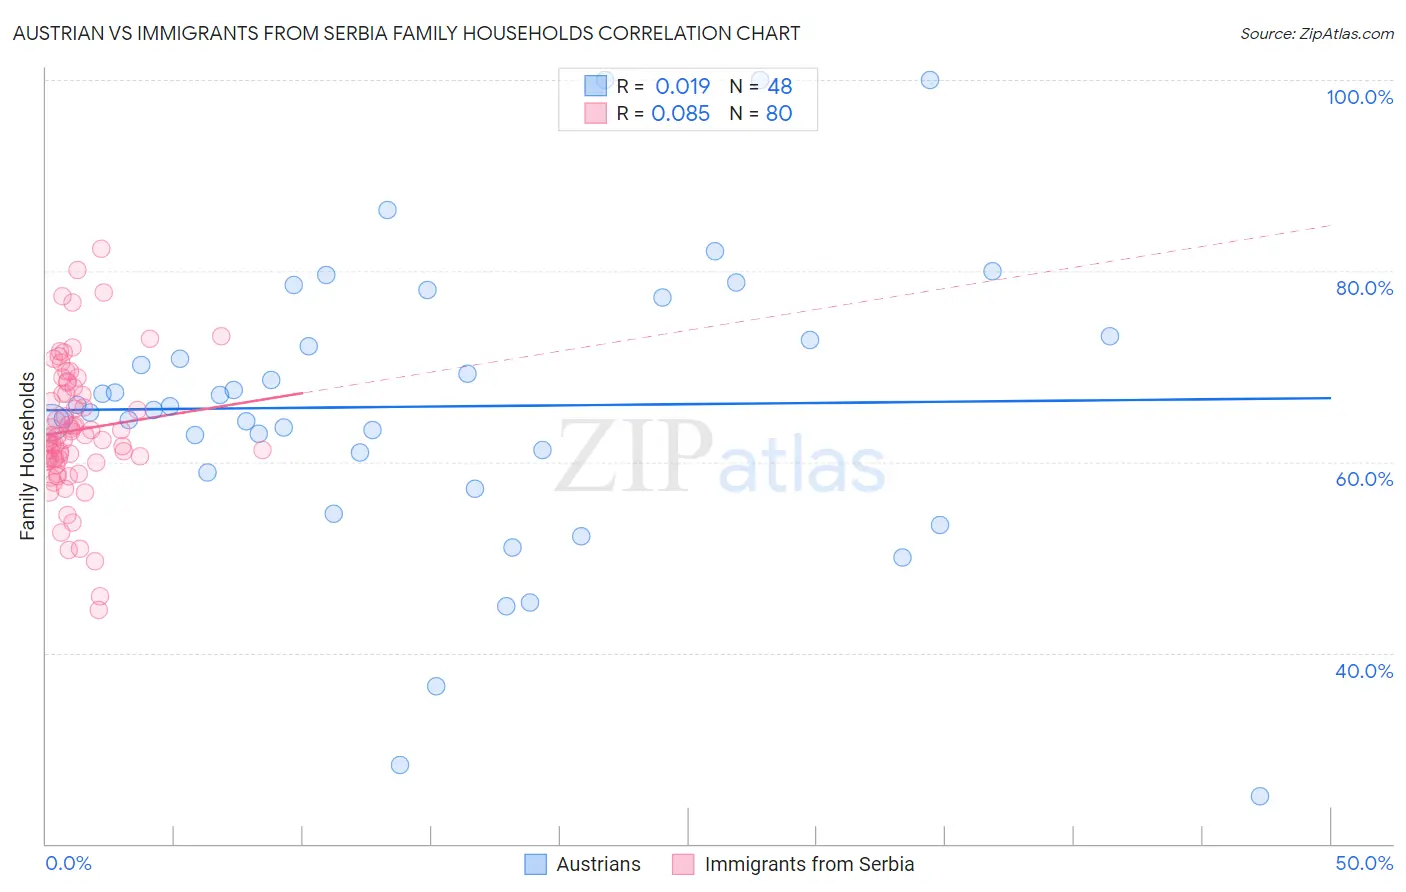
Austrian vs Immigrants from Serbia Family Households Correlation Chart
The statistical analysis conducted on geographies consisting of 451,810,725 people shows no correlation between the proportion of Austrians and percentage of family households in the United States with a correlation coefficient (R) of 0.019 and weighted average of 64.5%. Similarly, the statistical analysis conducted on geographies consisting of 131,724,151 people shows a slight positive correlation between the proportion of Immigrants from Serbia and percentage of family households in the United States with a correlation coefficient (R) of 0.085 and weighted average of 61.6%, a difference of 4.6%.
Family Households Correlation Summary
| Measurement | Austrian | Immigrants from Serbia |
| Minimum | 25.0% | 44.5% |
| Maximum | 100.0% | 82.3% |
| Range | 75.0% | 37.8% |
| Mean | 65.8% | 63.4% |
| Median | 65.7% | 62.6% |
| Interquartile 25% (IQ1) | 60.0% | 60.2% |
| Interquartile 75% (IQ3) | 72.9% | 67.5% |
| Interquartile Range (IQR) | 13.0% | 7.3% |
| Standard Deviation (Sample) | 15.5% | 7.0% |
| Standard Deviation (Population) | 15.4% | 7.0% |
Similar Demographics by Family Households
Demographics Similar to Austrians by Family Households
In terms of family households, the demographic groups most similar to Austrians are Uruguayan (64.5%, a difference of 0.010%), Swedish (64.5%, a difference of 0.020%), Czech (64.5%, a difference of 0.020%), Canadian (64.4%, a difference of 0.030%), and Lebanese (64.4%, a difference of 0.030%).
| Demographics | Rating | Rank | Family Households |
| Immigrants | Chile | 76.5 /100 | #147 | Good 64.6% |
| Delaware | 76.3 /100 | #148 | Good 64.6% |
| Sioux | 76.3 /100 | #149 | Good 64.6% |
| Romanians | 75.3 /100 | #150 | Good 64.5% |
| Syrians | 75.2 /100 | #151 | Good 64.5% |
| Scottish | 70.9 /100 | #152 | Good 64.5% |
| Swedes | 69.8 /100 | #153 | Good 64.5% |
| Austrians | 68.5 /100 | #154 | Good 64.5% |
| Uruguayans | 67.7 /100 | #155 | Good 64.5% |
| Czechs | 67.0 /100 | #156 | Good 64.5% |
| Canadians | 66.6 /100 | #157 | Good 64.4% |
| Lebanese | 66.4 /100 | #158 | Good 64.4% |
| Germans | 65.8 /100 | #159 | Good 64.4% |
| Immigrants | Moldova | 65.2 /100 | #160 | Good 64.4% |
| Immigrants | England | 62.6 /100 | #161 | Good 64.4% |
Demographics Similar to Immigrants from Serbia by Family Households
In terms of family households, the demographic groups most similar to Immigrants from Serbia are Tlingit-Haida (61.6%, a difference of 0.010%), Immigrants from West Indies (61.6%, a difference of 0.010%), Immigrants from Switzerland (61.6%, a difference of 0.020%), Alsatian (61.7%, a difference of 0.090%), and Ugandan (61.7%, a difference of 0.14%).
| Demographics | Rating | Rank | Family Households |
| Moroccans | 0.0 /100 | #315 | Tragic 61.9% |
| Immigrants | Middle Africa | 0.0 /100 | #316 | Tragic 61.9% |
| Immigrants | Bosnia and Herzegovina | 0.0 /100 | #317 | Tragic 61.9% |
| Alaskan Athabascans | 0.0 /100 | #318 | Tragic 61.8% |
| Cape Verdeans | 0.0 /100 | #319 | Tragic 61.8% |
| Ugandans | 0.0 /100 | #320 | Tragic 61.7% |
| Alsatians | 0.0 /100 | #321 | Tragic 61.7% |
| Immigrants | Serbia | 0.0 /100 | #322 | Tragic 61.6% |
| Tlingit-Haida | 0.0 /100 | #323 | Tragic 61.6% |
| Immigrants | West Indies | 0.0 /100 | #324 | Tragic 61.6% |
| Immigrants | Switzerland | 0.0 /100 | #325 | Tragic 61.6% |
| Indonesians | 0.0 /100 | #326 | Tragic 61.5% |
| Blacks/African Americans | 0.0 /100 | #327 | Tragic 61.5% |
| Kiowa | 0.0 /100 | #328 | Tragic 61.4% |
| Cambodians | 0.0 /100 | #329 | Tragic 61.4% |