Austrian vs Immigrants from Eastern Europe Child Poverty Among Girls Under 16
COMPARE
Austrian
Immigrants from Eastern Europe
Child Poverty Among Girls Under 16
Child Poverty Among Girls Under 16 Comparison
Austrians
Immigrants from Eastern Europe
14.9%
CHILD POVERTY AMONG GIRLS UNDER 16
96.7/ 100
METRIC RATING
92nd/ 347
METRIC RANK
14.6%
CHILD POVERTY AMONG GIRLS UNDER 16
98.0/ 100
METRIC RATING
75th/ 347
METRIC RANK
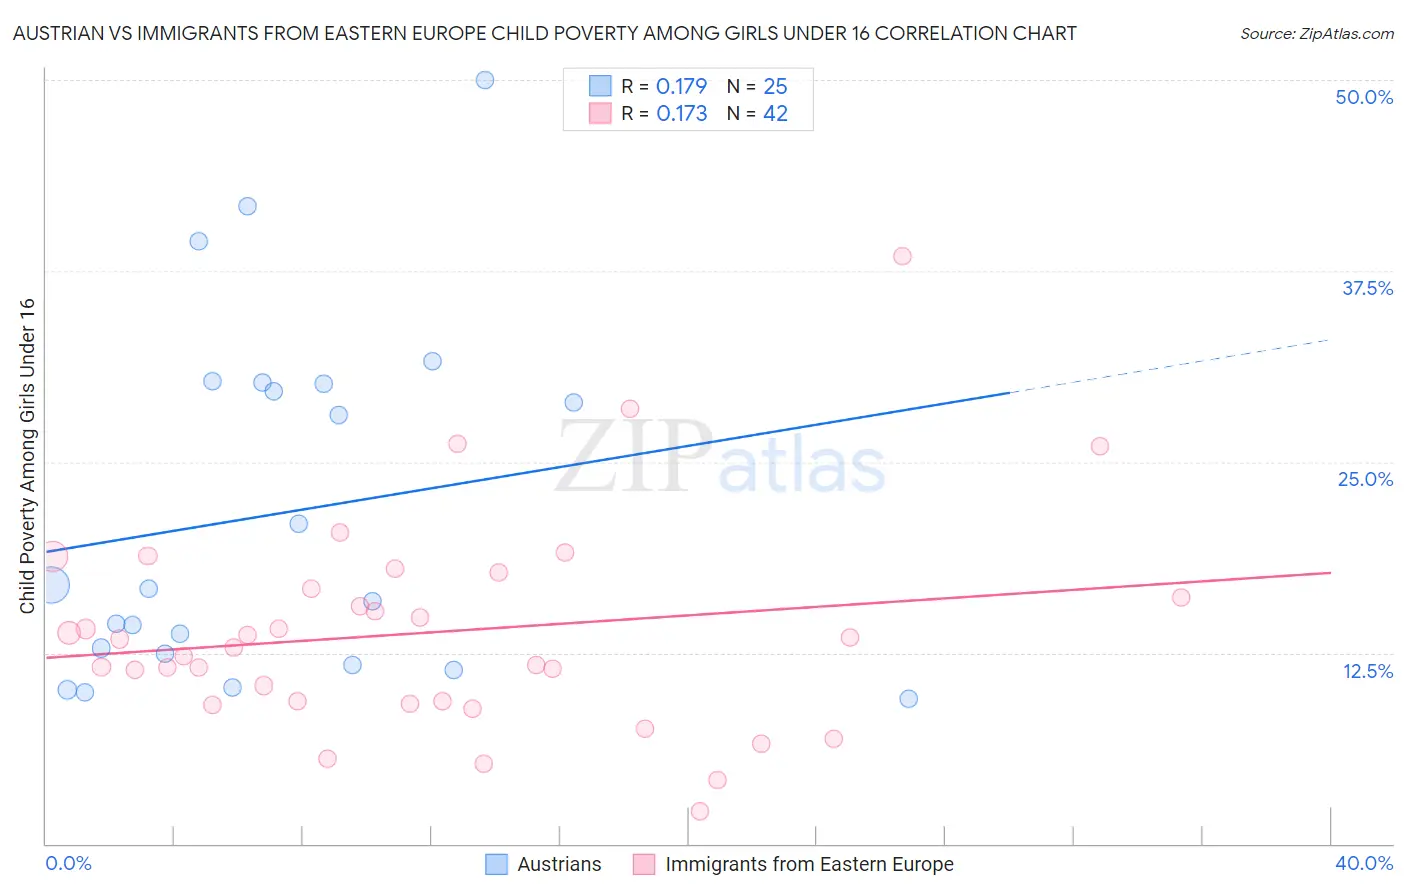
Austrian vs Immigrants from Eastern Europe Child Poverty Among Girls Under 16 Correlation Chart
The statistical analysis conducted on geographies consisting of 439,542,815 people shows a poor positive correlation between the proportion of Austrians and poverty level among girls under the age of 16 in the United States with a correlation coefficient (R) of 0.179 and weighted average of 14.9%. Similarly, the statistical analysis conducted on geographies consisting of 462,372,791 people shows a poor positive correlation between the proportion of Immigrants from Eastern Europe and poverty level among girls under the age of 16 in the United States with a correlation coefficient (R) of 0.173 and weighted average of 14.6%, a difference of 1.7%.
Child Poverty Among Girls Under 16 Correlation Summary
| Measurement | Austrian | Immigrants from Eastern Europe |
| Minimum | 9.5% | 2.1% |
| Maximum | 50.0% | 38.5% |
| Range | 40.5% | 36.4% |
| Mean | 21.6% | 13.8% |
| Median | 16.7% | 13.1% |
| Interquartile 25% (IQ1) | 12.1% | 9.3% |
| Interquartile 75% (IQ3) | 30.2% | 16.7% |
| Interquartile Range (IQR) | 18.1% | 7.4% |
| Standard Deviation (Sample) | 11.5% | 6.9% |
| Standard Deviation (Population) | 11.3% | 6.8% |
Demographics Similar to Austrians and Immigrants from Eastern Europe by Child Poverty Among Girls Under 16
In terms of child poverty among girls under 16, the demographic groups most similar to Austrians are Immigrants from North America (14.9%, a difference of 0.070%), Immigrants from Belarus (14.8%, a difference of 0.35%), Northern European (14.8%, a difference of 0.39%), Jordanian (14.8%, a difference of 0.41%), and Immigrants from Canada (14.8%, a difference of 0.46%). Similarly, the demographic groups most similar to Immigrants from Eastern Europe are Taiwanese (14.6%, a difference of 0.070%), Immigrants from Austria (14.6%, a difference of 0.10%), Immigrants from Russia (14.7%, a difference of 0.15%), Tlingit-Haida (14.7%, a difference of 0.16%), and Argentinean (14.7%, a difference of 0.16%).
| Demographics | Rating | Rank | Child Poverty Among Girls Under 16 |
| Immigrants | Austria | 98.0 /100 | #73 | Exceptional 14.6% |
| Taiwanese | 98.0 /100 | #74 | Exceptional 14.6% |
| Immigrants | Eastern Europe | 98.0 /100 | #75 | Exceptional 14.6% |
| Immigrants | Russia | 97.9 /100 | #76 | Exceptional 14.7% |
| Tlingit-Haida | 97.9 /100 | #77 | Exceptional 14.7% |
| Argentineans | 97.9 /100 | #78 | Exceptional 14.7% |
| Immigrants | Turkey | 97.9 /100 | #79 | Exceptional 14.7% |
| Egyptians | 97.9 /100 | #80 | Exceptional 14.7% |
| Ukrainians | 97.7 /100 | #81 | Exceptional 14.7% |
| Macedonians | 97.6 /100 | #82 | Exceptional 14.7% |
| Immigrants | Italy | 97.4 /100 | #83 | Exceptional 14.8% |
| Soviet Union | 97.3 /100 | #84 | Exceptional 14.8% |
| Swiss | 97.2 /100 | #85 | Exceptional 14.8% |
| Australians | 97.2 /100 | #86 | Exceptional 14.8% |
| Finns | 97.2 /100 | #87 | Exceptional 14.8% |
| Immigrants | Canada | 97.1 /100 | #88 | Exceptional 14.8% |
| Jordanians | 97.1 /100 | #89 | Exceptional 14.8% |
| Northern Europeans | 97.0 /100 | #90 | Exceptional 14.8% |
| Immigrants | Belarus | 97.0 /100 | #91 | Exceptional 14.8% |
| Austrians | 96.7 /100 | #92 | Exceptional 14.9% |
| Immigrants | North America | 96.6 /100 | #93 | Exceptional 14.9% |