Immigrants from Korea vs Immigrants from Eastern Europe Family Households
COMPARE
Immigrants from Korea
Immigrants from Eastern Europe
Family Households
Family Households Comparison
Immigrants from Korea
Immigrants from Eastern Europe
66.0%
FAMILY HOUSEHOLDS
100.0/ 100
METRIC RATING
59th/ 347
METRIC RANK
64.0%
FAMILY HOUSEHOLDS
17.2/ 100
METRIC RATING
201st/ 347
METRIC RANK
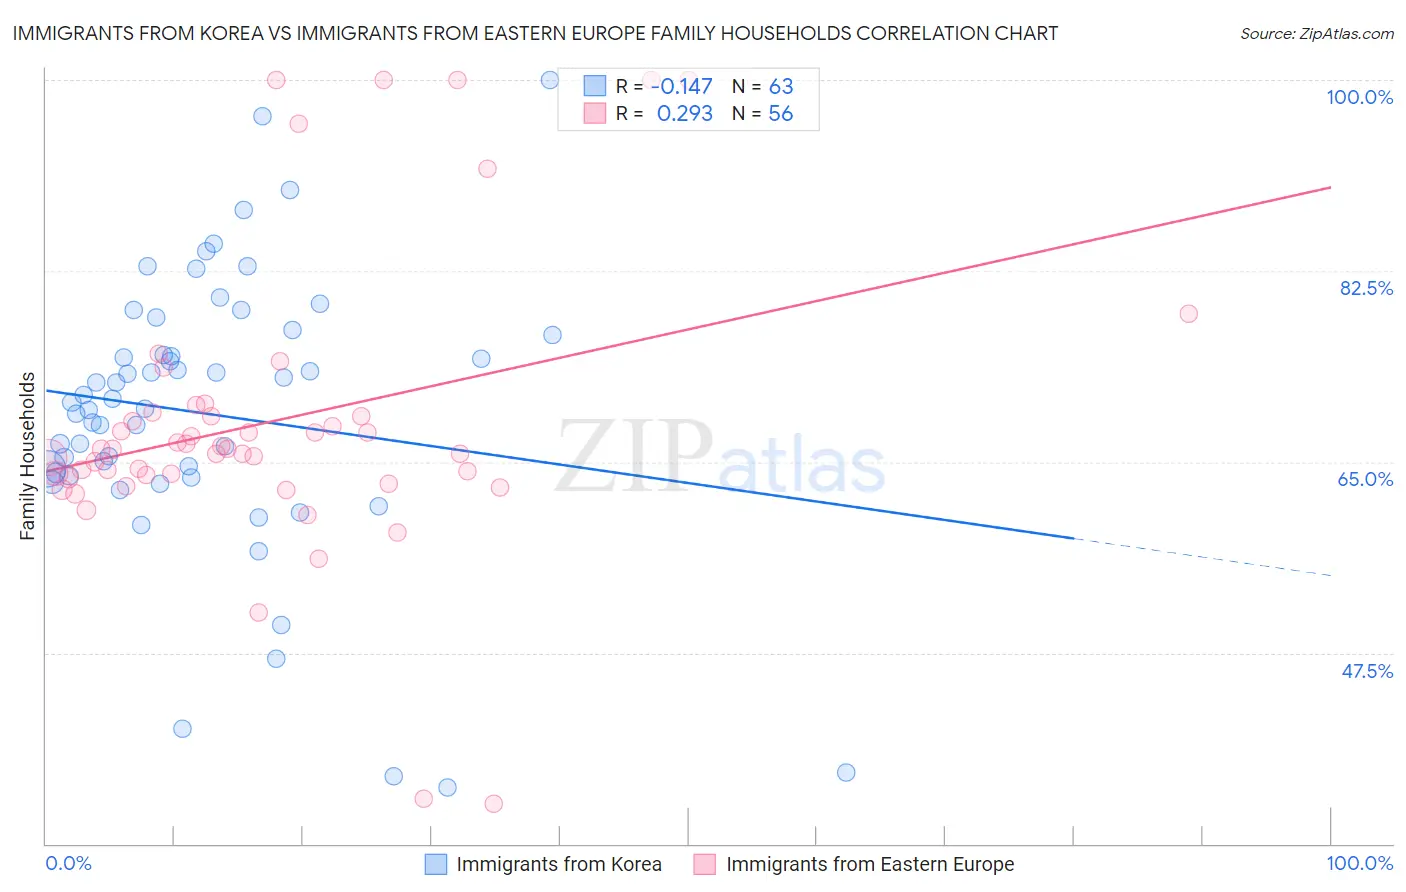
Immigrants from Korea vs Immigrants from Eastern Europe Family Households Correlation Chart
The statistical analysis conducted on geographies consisting of 415,966,940 people shows a poor negative correlation between the proportion of Immigrants from Korea and percentage of family households in the United States with a correlation coefficient (R) of -0.147 and weighted average of 66.0%. Similarly, the statistical analysis conducted on geographies consisting of 475,514,263 people shows a weak positive correlation between the proportion of Immigrants from Eastern Europe and percentage of family households in the United States with a correlation coefficient (R) of 0.293 and weighted average of 64.0%, a difference of 3.3%.
Family Households Correlation Summary
| Measurement | Immigrants from Korea | Immigrants from Eastern Europe |
| Minimum | 35.2% | 33.7% |
| Maximum | 100.0% | 100.0% |
| Range | 64.8% | 66.3% |
| Mean | 69.4% | 68.7% |
| Median | 70.4% | 66.2% |
| Interquartile 25% (IQ1) | 63.7% | 63.7% |
| Interquartile 75% (IQ3) | 76.6% | 69.4% |
| Interquartile Range (IQR) | 12.9% | 5.7% |
| Standard Deviation (Sample) | 12.8% | 13.5% |
| Standard Deviation (Population) | 12.7% | 13.4% |
Similar Demographics by Family Households
Demographics Similar to Immigrants from Korea by Family Households
In terms of family households, the demographic groups most similar to Immigrants from Korea are South American (66.0%, a difference of 0.010%), Immigrants from Asia (66.1%, a difference of 0.020%), Danish (66.0%, a difference of 0.030%), Central American (66.0%, a difference of 0.060%), and Immigrants from Indonesia (66.0%, a difference of 0.10%).
| Demographics | Rating | Rank | Family Households |
| Colombians | 100.0 /100 | #52 | Exceptional 66.3% |
| Afghans | 100.0 /100 | #53 | Exceptional 66.3% |
| Immigrants | Colombia | 100.0 /100 | #54 | Exceptional 66.3% |
| Immigrants | Immigrants | 100.0 /100 | #55 | Exceptional 66.1% |
| Immigrants | Hong Kong | 100.0 /100 | #56 | Exceptional 66.1% |
| Pennsylvania Germans | 100.0 /100 | #57 | Exceptional 66.1% |
| Immigrants | Asia | 100.0 /100 | #58 | Exceptional 66.1% |
| Immigrants | Korea | 100.0 /100 | #59 | Exceptional 66.0% |
| South Americans | 100.0 /100 | #60 | Exceptional 66.0% |
| Danes | 100.0 /100 | #61 | Exceptional 66.0% |
| Central Americans | 100.0 /100 | #62 | Exceptional 66.0% |
| Immigrants | Indonesia | 100.0 /100 | #63 | Exceptional 66.0% |
| Pima | 99.9 /100 | #64 | Exceptional 65.9% |
| Costa Ricans | 99.9 /100 | #65 | Exceptional 65.9% |
| Fijians | 99.9 /100 | #66 | Exceptional 65.9% |
Demographics Similar to Immigrants from Eastern Europe by Family Households
In terms of family households, the demographic groups most similar to Immigrants from Eastern Europe are Immigrants from Malaysia (64.0%, a difference of 0.020%), Slavic (64.0%, a difference of 0.030%), Immigrants from Canada (64.0%, a difference of 0.040%), Seminole (64.0%, a difference of 0.040%), and Polish (64.0%, a difference of 0.040%).
| Demographics | Rating | Rank | Family Households |
| Paiute | 22.2 /100 | #194 | Fair 64.0% |
| Immigrants | North America | 20.0 /100 | #195 | Poor 64.0% |
| Immigrants | Canada | 19.2 /100 | #196 | Poor 64.0% |
| Seminole | 18.9 /100 | #197 | Poor 64.0% |
| Poles | 18.9 /100 | #198 | Poor 64.0% |
| Slavs | 18.6 /100 | #199 | Poor 64.0% |
| Immigrants | Malaysia | 17.9 /100 | #200 | Poor 64.0% |
| Immigrants | Eastern Europe | 17.2 /100 | #201 | Poor 64.0% |
| Iranians | 13.5 /100 | #202 | Poor 63.9% |
| Norwegians | 13.2 /100 | #203 | Poor 63.9% |
| Immigrants | Uruguay | 12.8 /100 | #204 | Poor 63.9% |
| Brazilians | 12.4 /100 | #205 | Poor 63.9% |
| Immigrants | Lithuania | 12.1 /100 | #206 | Poor 63.9% |
| Nigerians | 11.5 /100 | #207 | Poor 63.9% |
| Immigrants | Bangladesh | 11.4 /100 | #208 | Poor 63.9% |