Immigrants from Jordan vs Immigrants from Belize Family Households
COMPARE
Immigrants from Jordan
Immigrants from Belize
Family Households
Family Households Comparison
Immigrants from Jordan
Immigrants from Belize
65.0%
FAMILY HOUSEHOLDS
96.5/ 100
METRIC RATING
112th/ 347
METRIC RANK
64.9%
FAMILY HOUSEHOLDS
92.7/ 100
METRIC RATING
125th/ 347
METRIC RANK
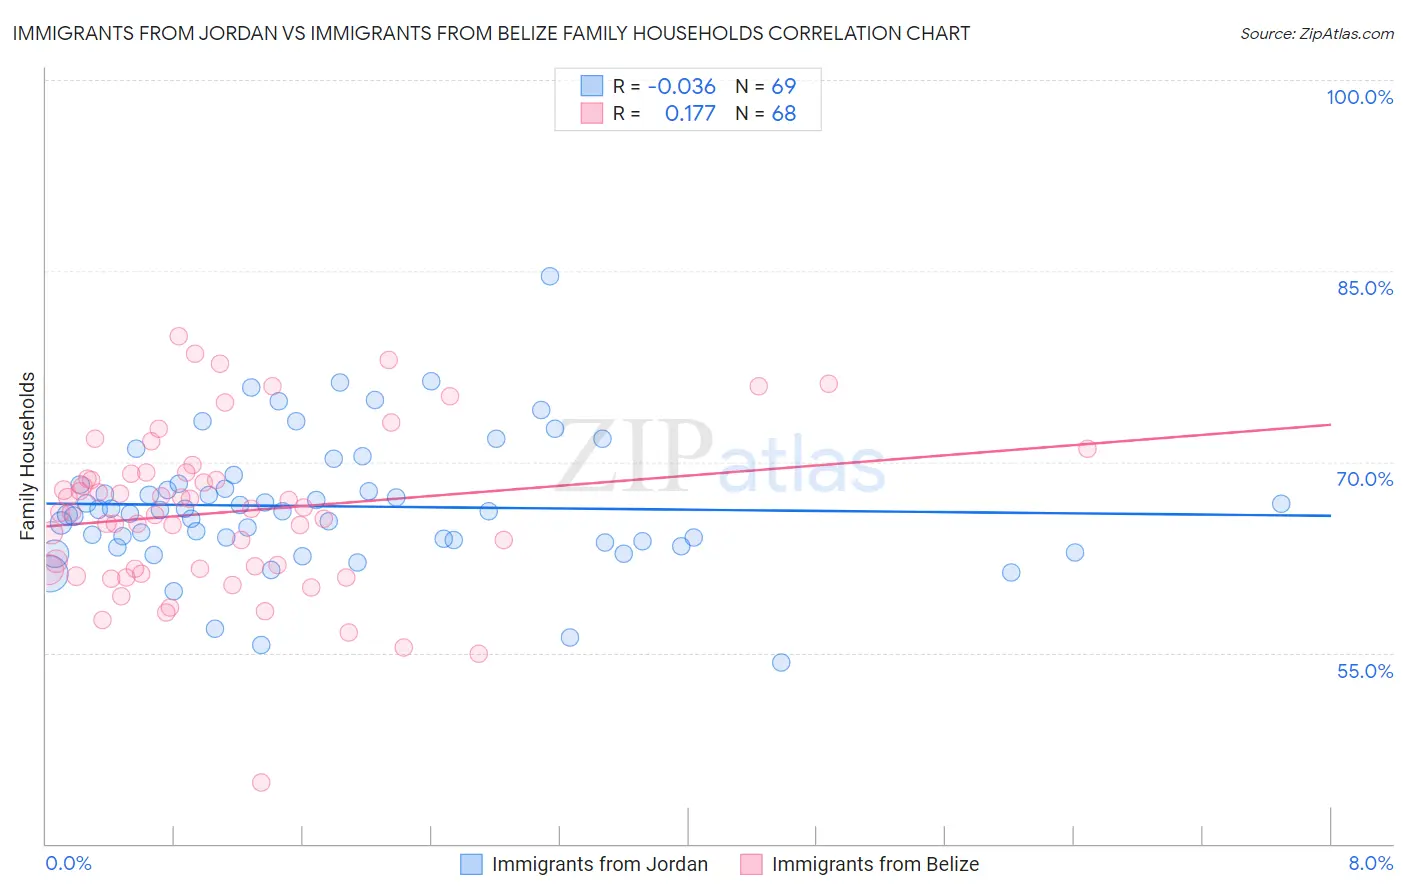
Immigrants from Jordan vs Immigrants from Belize Family Households Correlation Chart
The statistical analysis conducted on geographies consisting of 181,252,628 people shows no correlation between the proportion of Immigrants from Jordan and percentage of family households in the United States with a correlation coefficient (R) of -0.036 and weighted average of 65.0%. Similarly, the statistical analysis conducted on geographies consisting of 130,284,292 people shows a poor positive correlation between the proportion of Immigrants from Belize and percentage of family households in the United States with a correlation coefficient (R) of 0.177 and weighted average of 64.9%, a difference of 0.25%.
Family Households Correlation Summary
| Measurement | Immigrants from Jordan | Immigrants from Belize |
| Minimum | 54.2% | 44.8% |
| Maximum | 84.6% | 79.8% |
| Range | 30.4% | 35.1% |
| Mean | 66.5% | 66.0% |
| Median | 66.1% | 66.2% |
| Interquartile 25% (IQ1) | 63.7% | 61.5% |
| Interquartile 75% (IQ3) | 68.3% | 69.1% |
| Interquartile Range (IQR) | 4.6% | 7.5% |
| Standard Deviation (Sample) | 5.2% | 6.4% |
| Standard Deviation (Population) | 5.1% | 6.4% |
Demographics Similar to Immigrants from Jordan and Immigrants from Belize by Family Households
In terms of family households, the demographic groups most similar to Immigrants from Jordan are European (65.0%, a difference of 0.030%), Spanish (65.0%, a difference of 0.030%), Scandinavian (65.0%, a difference of 0.040%), Immigrants from Guatemala (65.0%, a difference of 0.050%), and Argentinean (65.0%, a difference of 0.060%). Similarly, the demographic groups most similar to Immigrants from Belize are Immigrants from Argentina (64.9%, a difference of 0.010%), Panamanian (64.8%, a difference of 0.020%), Hmong (64.9%, a difference of 0.030%), Choctaw (64.9%, a difference of 0.030%), and Immigrants from Panama (64.8%, a difference of 0.030%).
| Demographics | Rating | Rank | Family Households |
| Palestinians | 97.2 /100 | #108 | Exceptional 65.1% |
| Immigrants | Guatemala | 96.9 /100 | #109 | Exceptional 65.0% |
| Scandinavians | 96.8 /100 | #110 | Exceptional 65.0% |
| Europeans | 96.8 /100 | #111 | Exceptional 65.0% |
| Immigrants | Jordan | 96.5 /100 | #112 | Exceptional 65.0% |
| Spanish | 96.2 /100 | #113 | Exceptional 65.0% |
| Argentineans | 95.7 /100 | #114 | Exceptional 65.0% |
| Ecuadorians | 95.4 /100 | #115 | Exceptional 65.0% |
| Immigrants | Iraq | 95.4 /100 | #116 | Exceptional 65.0% |
| Cherokee | 95.3 /100 | #117 | Exceptional 65.0% |
| Dutch | 95.1 /100 | #118 | Exceptional 64.9% |
| Immigrants | Eastern Asia | 94.4 /100 | #119 | Exceptional 64.9% |
| Immigrants | Oceania | 94.2 /100 | #120 | Exceptional 64.9% |
| Hungarians | 94.0 /100 | #121 | Exceptional 64.9% |
| Hmong | 93.4 /100 | #122 | Exceptional 64.9% |
| Choctaw | 93.4 /100 | #123 | Exceptional 64.9% |
| Immigrants | Argentina | 92.8 /100 | #124 | Exceptional 64.9% |
| Immigrants | Belize | 92.7 /100 | #125 | Exceptional 64.9% |
| Panamanians | 92.4 /100 | #126 | Exceptional 64.8% |
| Immigrants | Panama | 92.0 /100 | #127 | Exceptional 64.8% |
| Italians | 91.9 /100 | #128 | Exceptional 64.8% |