Celtic vs Immigrants from Belize Family Households
COMPARE
Celtic
Immigrants from Belize
Family Households
Family Households Comparison
Celtics
Immigrants from Belize
63.8%
FAMILY HOUSEHOLDS
8.0/ 100
METRIC RATING
214th/ 347
METRIC RANK
64.9%
FAMILY HOUSEHOLDS
92.7/ 100
METRIC RATING
125th/ 347
METRIC RANK
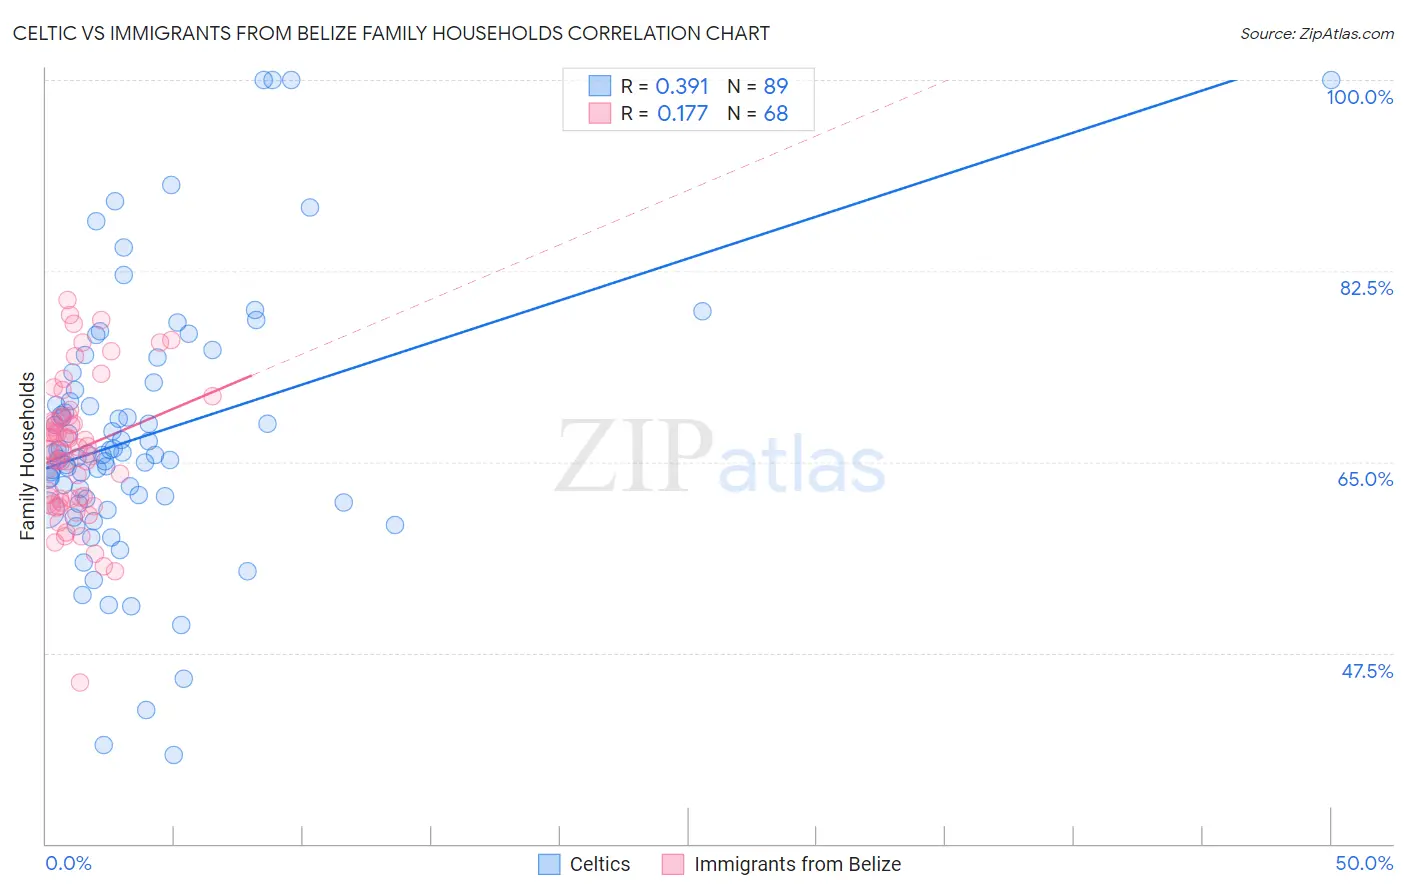
Celtic vs Immigrants from Belize Family Households Correlation Chart
The statistical analysis conducted on geographies consisting of 168,846,430 people shows a mild positive correlation between the proportion of Celtics and percentage of family households in the United States with a correlation coefficient (R) of 0.391 and weighted average of 63.8%. Similarly, the statistical analysis conducted on geographies consisting of 130,284,292 people shows a poor positive correlation between the proportion of Immigrants from Belize and percentage of family households in the United States with a correlation coefficient (R) of 0.177 and weighted average of 64.9%, a difference of 1.7%.
Family Households Correlation Summary
| Measurement | Celtic | Immigrants from Belize |
| Minimum | 38.1% | 44.8% |
| Maximum | 100.0% | 79.8% |
| Range | 61.9% | 35.1% |
| Mean | 67.4% | 66.0% |
| Median | 65.8% | 66.2% |
| Interquartile 25% (IQ1) | 61.4% | 61.5% |
| Interquartile 75% (IQ3) | 71.9% | 69.1% |
| Interquartile Range (IQR) | 10.5% | 7.5% |
| Standard Deviation (Sample) | 12.1% | 6.4% |
| Standard Deviation (Population) | 12.0% | 6.4% |
Similar Demographics by Family Households
Demographics Similar to Celtics by Family Households
In terms of family households, the demographic groups most similar to Celtics are Belgian (63.8%, a difference of 0.020%), Croatian (63.8%, a difference of 0.030%), Immigrants from Northern Europe (63.8%, a difference of 0.040%), Osage (63.7%, a difference of 0.050%), and Marshallese (63.7%, a difference of 0.050%).
| Demographics | Rating | Rank | Family Households |
| Nigerians | 11.5 /100 | #207 | Poor 63.9% |
| Immigrants | Bangladesh | 11.4 /100 | #208 | Poor 63.9% |
| Sierra Leoneans | 11.2 /100 | #209 | Poor 63.9% |
| Immigrants | Thailand | 9.6 /100 | #210 | Tragic 63.8% |
| Shoshone | 9.4 /100 | #211 | Tragic 63.8% |
| Immigrants | Netherlands | 9.4 /100 | #212 | Tragic 63.8% |
| Immigrants | Northern Europe | 8.8 /100 | #213 | Tragic 63.8% |
| Celtics | 8.0 /100 | #214 | Tragic 63.8% |
| Belgians | 7.6 /100 | #215 | Tragic 63.8% |
| Croatians | 7.3 /100 | #216 | Tragic 63.8% |
| Osage | 7.0 /100 | #217 | Tragic 63.7% |
| Marshallese | 6.9 /100 | #218 | Tragic 63.7% |
| Macedonians | 6.5 /100 | #219 | Tragic 63.7% |
| Immigrants | Europe | 6.4 /100 | #220 | Tragic 63.7% |
| Immigrants | South Africa | 5.9 /100 | #221 | Tragic 63.7% |
Demographics Similar to Immigrants from Belize by Family Households
In terms of family households, the demographic groups most similar to Immigrants from Belize are Immigrants from Argentina (64.9%, a difference of 0.010%), Panamanian (64.8%, a difference of 0.020%), Hmong (64.9%, a difference of 0.030%), Choctaw (64.9%, a difference of 0.030%), and Immigrants from Panama (64.8%, a difference of 0.030%).
| Demographics | Rating | Rank | Family Households |
| Dutch | 95.1 /100 | #118 | Exceptional 64.9% |
| Immigrants | Eastern Asia | 94.4 /100 | #119 | Exceptional 64.9% |
| Immigrants | Oceania | 94.2 /100 | #120 | Exceptional 64.9% |
| Hungarians | 94.0 /100 | #121 | Exceptional 64.9% |
| Hmong | 93.4 /100 | #122 | Exceptional 64.9% |
| Choctaw | 93.4 /100 | #123 | Exceptional 64.9% |
| Immigrants | Argentina | 92.8 /100 | #124 | Exceptional 64.9% |
| Immigrants | Belize | 92.7 /100 | #125 | Exceptional 64.9% |
| Panamanians | 92.4 /100 | #126 | Exceptional 64.8% |
| Immigrants | Panama | 92.0 /100 | #127 | Exceptional 64.8% |
| Italians | 91.9 /100 | #128 | Exceptional 64.8% |
| Immigrants | Ecuador | 91.4 /100 | #129 | Exceptional 64.8% |
| Immigrants | Italy | 90.2 /100 | #130 | Exceptional 64.8% |
| Immigrants | Nonimmigrants | 90.1 /100 | #131 | Exceptional 64.8% |
| Cajuns | 89.4 /100 | #132 | Excellent 64.8% |