Immigrants from Ecuador vs Immigrants from Belize Family Households
COMPARE
Immigrants from Ecuador
Immigrants from Belize
Family Households
Family Households Comparison
Immigrants from Ecuador
Immigrants from Belize
64.8%
FAMILY HOUSEHOLDS
91.4/ 100
METRIC RATING
129th/ 347
METRIC RANK
64.9%
FAMILY HOUSEHOLDS
92.7/ 100
METRIC RATING
125th/ 347
METRIC RANK
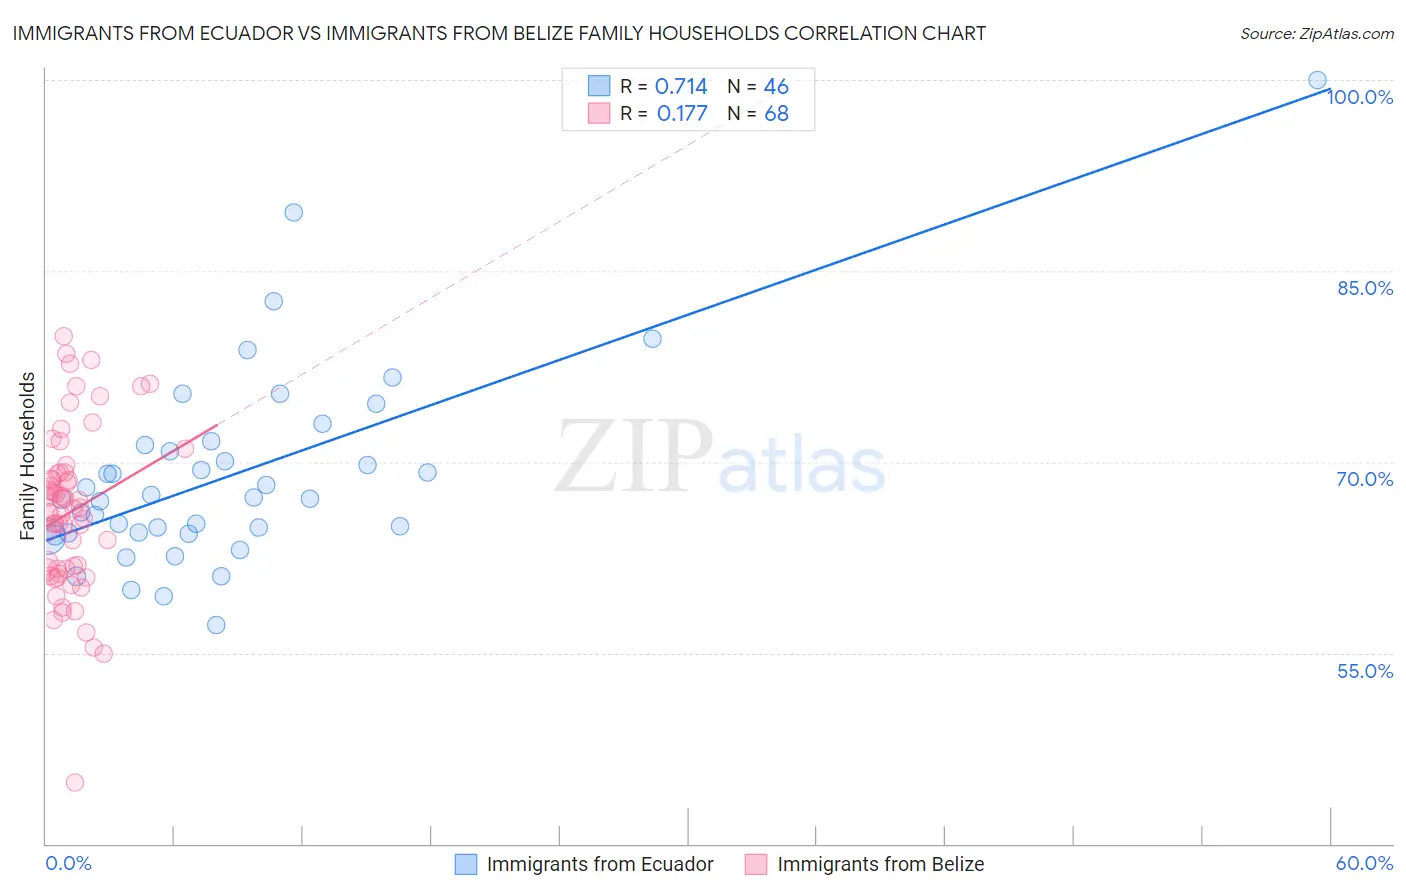
Immigrants from Ecuador vs Immigrants from Belize Family Households Correlation Chart
The statistical analysis conducted on geographies consisting of 270,888,190 people shows a strong positive correlation between the proportion of Immigrants from Ecuador and percentage of family households in the United States with a correlation coefficient (R) of 0.714 and weighted average of 64.8%. Similarly, the statistical analysis conducted on geographies consisting of 130,284,292 people shows a poor positive correlation between the proportion of Immigrants from Belize and percentage of family households in the United States with a correlation coefficient (R) of 0.177 and weighted average of 64.9%, a difference of 0.060%.
Family Households Correlation Summary
| Measurement | Immigrants from Ecuador | Immigrants from Belize |
| Minimum | 57.2% | 44.8% |
| Maximum | 100.0% | 79.8% |
| Range | 42.8% | 35.1% |
| Mean | 69.0% | 66.0% |
| Median | 67.2% | 66.2% |
| Interquartile 25% (IQ1) | 64.4% | 61.5% |
| Interquartile 75% (IQ3) | 71.4% | 69.1% |
| Interquartile Range (IQR) | 7.0% | 7.5% |
| Standard Deviation (Sample) | 7.8% | 6.4% |
| Standard Deviation (Population) | 7.8% | 6.4% |
Demographics Similar to Immigrants from Ecuador and Immigrants from Belize by Family Households
In terms of family households, the demographic groups most similar to Immigrants from Ecuador are Italian (64.8%, a difference of 0.020%), Immigrants from Panama (64.8%, a difference of 0.030%), Panamanian (64.8%, a difference of 0.050%), Immigrants from Italy (64.8%, a difference of 0.050%), and Nonimmigrants (64.8%, a difference of 0.050%). Similarly, the demographic groups most similar to Immigrants from Belize are Immigrants from Argentina (64.9%, a difference of 0.010%), Panamanian (64.8%, a difference of 0.020%), Hmong (64.9%, a difference of 0.030%), Choctaw (64.9%, a difference of 0.030%), and Immigrants from Panama (64.8%, a difference of 0.030%).
| Demographics | Rating | Rank | Family Households |
| Cherokee | 95.3 /100 | #117 | Exceptional 65.0% |
| Dutch | 95.1 /100 | #118 | Exceptional 64.9% |
| Immigrants | Eastern Asia | 94.4 /100 | #119 | Exceptional 64.9% |
| Immigrants | Oceania | 94.2 /100 | #120 | Exceptional 64.9% |
| Hungarians | 94.0 /100 | #121 | Exceptional 64.9% |
| Hmong | 93.4 /100 | #122 | Exceptional 64.9% |
| Choctaw | 93.4 /100 | #123 | Exceptional 64.9% |
| Immigrants | Argentina | 92.8 /100 | #124 | Exceptional 64.9% |
| Immigrants | Belize | 92.7 /100 | #125 | Exceptional 64.9% |
| Panamanians | 92.4 /100 | #126 | Exceptional 64.8% |
| Immigrants | Panama | 92.0 /100 | #127 | Exceptional 64.8% |
| Italians | 91.9 /100 | #128 | Exceptional 64.8% |
| Immigrants | Ecuador | 91.4 /100 | #129 | Exceptional 64.8% |
| Immigrants | Italy | 90.2 /100 | #130 | Exceptional 64.8% |
| Immigrants | Nonimmigrants | 90.1 /100 | #131 | Exceptional 64.8% |
| Cajuns | 89.4 /100 | #132 | Excellent 64.8% |
| Belizeans | 89.3 /100 | #133 | Excellent 64.8% |
| Greeks | 88.1 /100 | #134 | Excellent 64.7% |
| Maltese | 87.4 /100 | #135 | Excellent 64.7% |
| Immigrants | China | 86.6 /100 | #136 | Excellent 64.7% |
| Immigrants | Scotland | 86.4 /100 | #137 | Excellent 64.7% |