Austrian vs Immigrants from Belize Single Mother Households
COMPARE
Austrian
Immigrants from Belize
Single Mother Households
Single Mother Households Comparison
Austrians
Immigrants from Belize
5.7%
SINGLE MOTHER HOUSEHOLDS
96.4/ 100
METRIC RATING
96th/ 347
METRIC RANK
7.7%
SINGLE MOTHER HOUSEHOLDS
0.0/ 100
METRIC RATING
284th/ 347
METRIC RANK
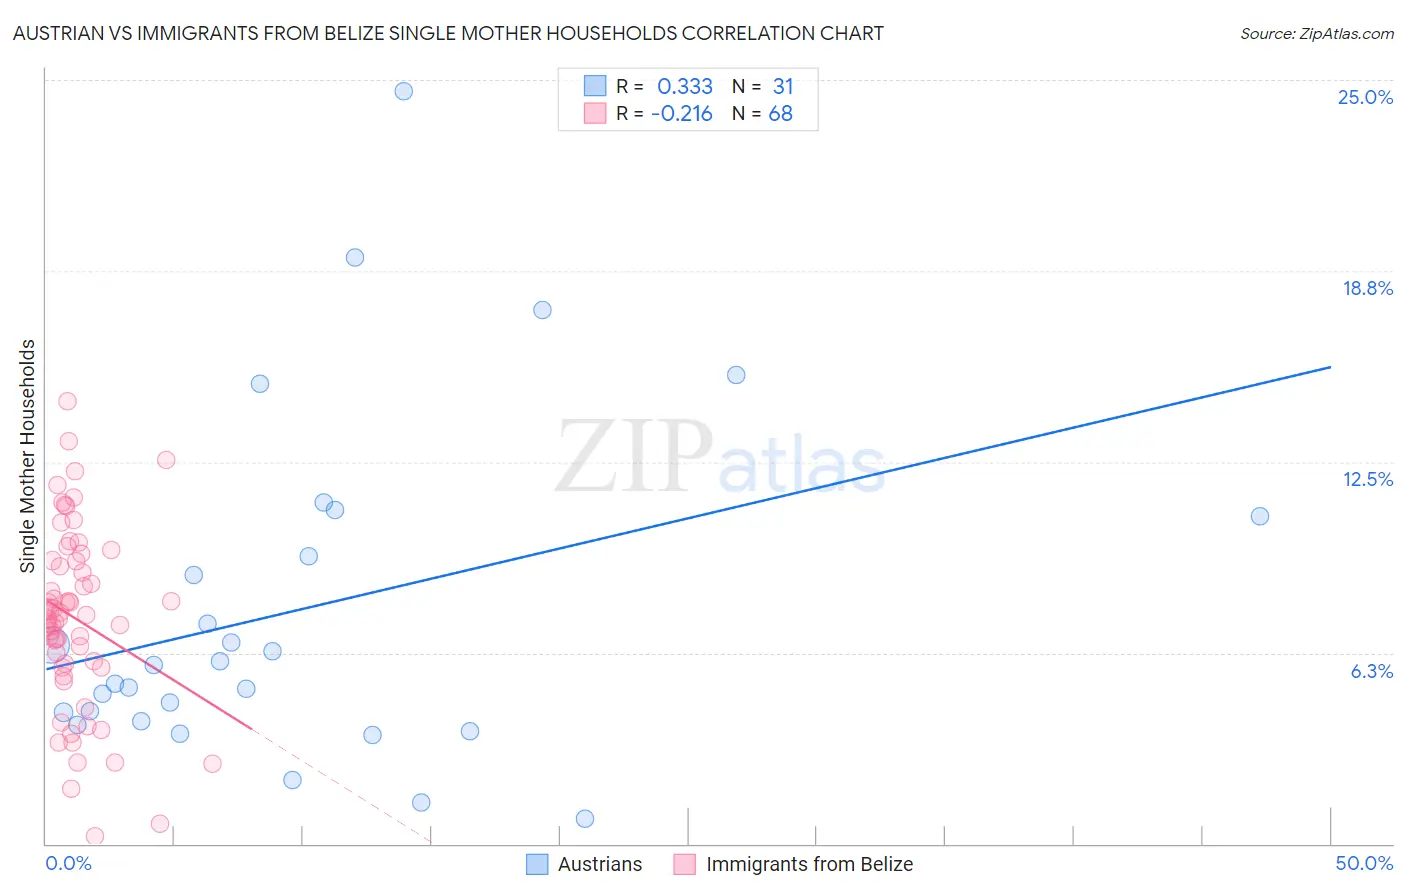
Austrian vs Immigrants from Belize Single Mother Households Correlation Chart
The statistical analysis conducted on geographies consisting of 449,998,235 people shows a mild positive correlation between the proportion of Austrians and percentage of single mother households in the United States with a correlation coefficient (R) of 0.333 and weighted average of 5.7%. Similarly, the statistical analysis conducted on geographies consisting of 130,177,465 people shows a weak negative correlation between the proportion of Immigrants from Belize and percentage of single mother households in the United States with a correlation coefficient (R) of -0.216 and weighted average of 7.7%, a difference of 34.3%.
Single Mother Households Correlation Summary
| Measurement | Austrian | Immigrants from Belize |
| Minimum | 0.83% | 0.26% |
| Maximum | 24.6% | 14.5% |
| Range | 23.8% | 14.2% |
| Mean | 7.7% | 7.4% |
| Median | 5.8% | 7.4% |
| Interquartile 25% (IQ1) | 4.0% | 5.8% |
| Interquartile 75% (IQ3) | 10.7% | 9.3% |
| Interquartile Range (IQR) | 6.7% | 3.4% |
| Standard Deviation (Sample) | 5.6% | 3.0% |
| Standard Deviation (Population) | 5.5% | 2.9% |
Similar Demographics by Single Mother Households
Demographics Similar to Austrians by Single Mother Households
In terms of single mother households, the demographic groups most similar to Austrians are Tlingit-Haida (5.7%, a difference of 0.050%), Immigrants from South Africa (5.7%, a difference of 0.090%), Slovak (5.7%, a difference of 0.15%), Immigrants from Poland (5.8%, a difference of 0.15%), and Scandinavian (5.8%, a difference of 0.16%).
| Demographics | Rating | Rank | Single Mother Households |
| Ukrainians | 97.2 /100 | #89 | Exceptional 5.7% |
| Immigrants | Indonesia | 97.2 /100 | #90 | Exceptional 5.7% |
| Europeans | 97.0 /100 | #91 | Exceptional 5.7% |
| Immigrants | Western Asia | 96.7 /100 | #92 | Exceptional 5.7% |
| Serbians | 96.7 /100 | #93 | Exceptional 5.7% |
| Basques | 96.7 /100 | #94 | Exceptional 5.7% |
| Slovaks | 96.6 /100 | #95 | Exceptional 5.7% |
| Austrians | 96.4 /100 | #96 | Exceptional 5.7% |
| Tlingit-Haida | 96.4 /100 | #97 | Exceptional 5.7% |
| Immigrants | South Africa | 96.3 /100 | #98 | Exceptional 5.7% |
| Immigrants | Poland | 96.3 /100 | #99 | Exceptional 5.8% |
| Scandinavians | 96.2 /100 | #100 | Exceptional 5.8% |
| Germans | 96.2 /100 | #101 | Exceptional 5.8% |
| English | 96.2 /100 | #102 | Exceptional 5.8% |
| Scottish | 96.2 /100 | #103 | Exceptional 5.8% |
Demographics Similar to Immigrants from Belize by Single Mother Households
In terms of single mother households, the demographic groups most similar to Immigrants from Belize are Trinidadian and Tobagonian (7.7%, a difference of 0.030%), Immigrants from Middle Africa (7.7%, a difference of 0.14%), Immigrants from Guatemala (7.7%, a difference of 0.24%), Sierra Leonean (7.7%, a difference of 0.29%), and Nigerian (7.7%, a difference of 0.60%).
| Demographics | Rating | Rank | Single Mother Households |
| Immigrants | Trinidad and Tobago | 0.1 /100 | #277 | Tragic 7.6% |
| Central Americans | 0.1 /100 | #278 | Tragic 7.6% |
| Immigrants | El Salvador | 0.0 /100 | #279 | Tragic 7.6% |
| Immigrants | Sierra Leone | 0.0 /100 | #280 | Tragic 7.7% |
| Immigrants | Laos | 0.0 /100 | #281 | Tragic 7.7% |
| Guatemalans | 0.0 /100 | #282 | Tragic 7.7% |
| Nigerians | 0.0 /100 | #283 | Tragic 7.7% |
| Immigrants | Belize | 0.0 /100 | #284 | Tragic 7.7% |
| Trinidadians and Tobagonians | 0.0 /100 | #285 | Tragic 7.7% |
| Immigrants | Middle Africa | 0.0 /100 | #286 | Tragic 7.7% |
| Immigrants | Guatemala | 0.0 /100 | #287 | Tragic 7.7% |
| Sierra Leoneans | 0.0 /100 | #288 | Tragic 7.7% |
| Sub-Saharan Africans | 0.0 /100 | #289 | Tragic 7.8% |
| Immigrants | Nigeria | 0.0 /100 | #290 | Tragic 7.8% |
| West Indians | 0.0 /100 | #291 | Tragic 7.8% |