Guamanian/Chamorro vs Mongolian Single Mother Households
COMPARE
Guamanian/Chamorro
Mongolian
Single Mother Households
Single Mother Households Comparison
Guamanians/Chamorros
Mongolians
6.6%
SINGLE MOTHER HOUSEHOLDS
12.4/ 100
METRIC RATING
202nd/ 347
METRIC RANK
5.8%
SINGLE MOTHER HOUSEHOLDS
95.3/ 100
METRIC RATING
113th/ 347
METRIC RANK
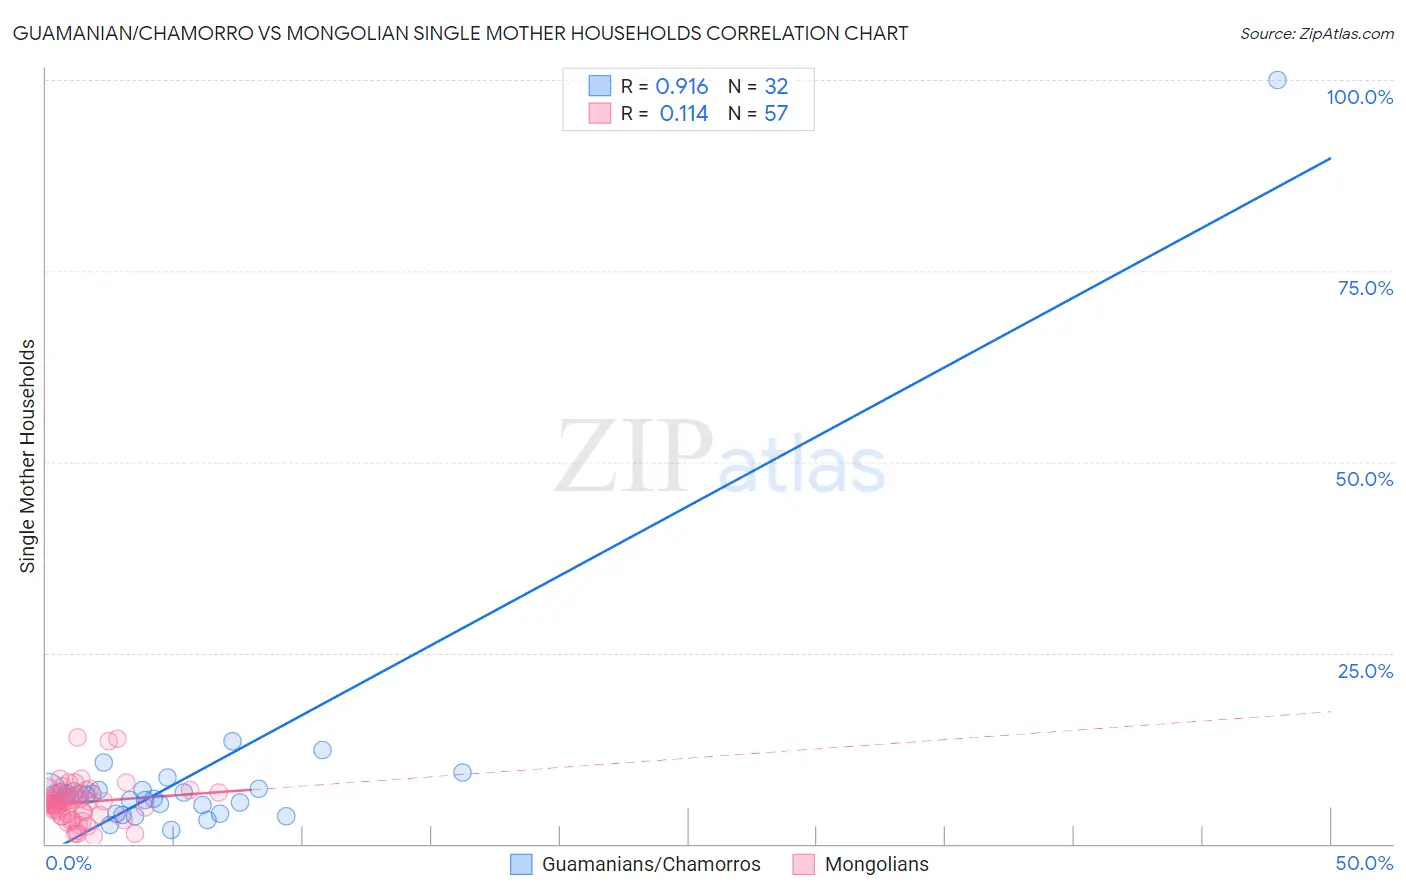
Guamanian/Chamorro vs Mongolian Single Mother Households Correlation Chart
The statistical analysis conducted on geographies consisting of 221,648,092 people shows a near-perfect positive correlation between the proportion of Guamanians/Chamorros and percentage of single mother households in the United States with a correlation coefficient (R) of 0.916 and weighted average of 6.6%. Similarly, the statistical analysis conducted on geographies consisting of 140,225,354 people shows a poor positive correlation between the proportion of Mongolians and percentage of single mother households in the United States with a correlation coefficient (R) of 0.114 and weighted average of 5.8%, a difference of 14.8%.
Single Mother Households Correlation Summary
| Measurement | Guamanian/Chamorro | Mongolian |
| Minimum | 1.8% | 0.92% |
| Maximum | 100.0% | 14.0% |
| Range | 98.2% | 13.0% |
| Mean | 9.2% | 5.4% |
| Median | 6.4% | 5.3% |
| Interquartile 25% (IQ1) | 4.5% | 3.7% |
| Interquartile 75% (IQ3) | 7.1% | 6.7% |
| Interquartile Range (IQR) | 2.5% | 3.0% |
| Standard Deviation (Sample) | 16.8% | 2.7% |
| Standard Deviation (Population) | 16.5% | 2.7% |
Similar Demographics by Single Mother Households
Demographics Similar to Guamanians/Chamorros by Single Mother Households
In terms of single mother households, the demographic groups most similar to Guamanians/Chamorros are Immigrants from Peru (6.7%, a difference of 0.090%), Immigrants from Fiji (6.7%, a difference of 0.11%), Venezuelan (6.6%, a difference of 0.12%), Cree (6.7%, a difference of 0.13%), and German Russian (6.7%, a difference of 0.21%).
| Demographics | Rating | Rank | Single Mother Households |
| South Americans | 18.0 /100 | #195 | Poor 6.6% |
| Uruguayans | 18.0 /100 | #196 | Poor 6.6% |
| Moroccans | 17.4 /100 | #197 | Poor 6.6% |
| Hawaiians | 16.1 /100 | #198 | Poor 6.6% |
| Potawatomi | 15.5 /100 | #199 | Poor 6.6% |
| Immigrants | Ethiopia | 14.7 /100 | #200 | Poor 6.6% |
| Venezuelans | 12.9 /100 | #201 | Poor 6.6% |
| Guamanians/Chamorros | 12.4 /100 | #202 | Poor 6.6% |
| Immigrants | Peru | 12.0 /100 | #203 | Poor 6.7% |
| Immigrants | Fiji | 11.9 /100 | #204 | Poor 6.7% |
| Cree | 11.9 /100 | #205 | Poor 6.7% |
| German Russians | 11.5 /100 | #206 | Poor 6.7% |
| Immigrants | South America | 11.5 /100 | #207 | Poor 6.7% |
| Vietnamese | 11.3 /100 | #208 | Poor 6.7% |
| Immigrants | Colombia | 10.5 /100 | #209 | Poor 6.7% |
Demographics Similar to Mongolians by Single Mother Households
In terms of single mother households, the demographic groups most similar to Mongolians are Immigrants from Kuwait (5.8%, a difference of 0.070%), Immigrants from England (5.8%, a difference of 0.11%), Dutch (5.8%, a difference of 0.13%), British (5.8%, a difference of 0.14%), and Immigrants from Western Europe (5.8%, a difference of 0.23%).
| Demographics | Rating | Rank | Single Mother Households |
| Immigrants | Ukraine | 95.9 /100 | #106 | Exceptional 5.8% |
| Paraguayans | 95.8 /100 | #107 | Exceptional 5.8% |
| Immigrants | Italy | 95.8 /100 | #108 | Exceptional 5.8% |
| Immigrants | Western Europe | 95.7 /100 | #109 | Exceptional 5.8% |
| British | 95.5 /100 | #110 | Exceptional 5.8% |
| Immigrants | England | 95.5 /100 | #111 | Exceptional 5.8% |
| Immigrants | Kuwait | 95.4 /100 | #112 | Exceptional 5.8% |
| Mongolians | 95.3 /100 | #113 | Exceptional 5.8% |
| Dutch | 95.1 /100 | #114 | Exceptional 5.8% |
| Irish | 94.8 /100 | #115 | Exceptional 5.8% |
| Pennsylvania Germans | 94.7 /100 | #116 | Exceptional 5.8% |
| Bolivians | 94.6 /100 | #117 | Exceptional 5.8% |
| Laotians | 94.3 /100 | #118 | Exceptional 5.8% |
| South Africans | 94.1 /100 | #119 | Exceptional 5.8% |
| Tongans | 93.7 /100 | #120 | Exceptional 5.8% |