Assyrian/Chaldean/Syriac vs West Indian Single Mother Households

COMPARE

Assyrian/Chaldean/Syriac
Race
Ancestry
AfghanAfricanAlaska NativeAlaskan AthabascanAlbanianAleutAlsatianAmericanApacheArabArapahoArgentineanArmenianAssyrian/Chaldean/SyriacAustralianAustrianBahamianBangladeshiBarbadianBasqueBelgianBelizeanBermudanBhutaneseBlackfeetBolivianBrazilianBritishBritish West IndianBulgarianBurmeseCajunCambodianCanadianCape VerdeanCarpatho RusynCelticCentral AmericanCentral American IndianCherokeeCheyenneChickasawChileanChineseChippewaChoctawColombianColvilleComancheCosta RicanCreeCreekCroatianCrowCubanCypriotCzechCzechoslovakianDanishDelawareDominicanDutchDutch West IndianEastern EuropeanEcuadorianEgyptianEnglishEstonianEthiopianEuropeanFijianFilipinoFinnishFrenchFrench American IndianFrench CanadianGermanGerman RussianGhanaianGreekGuamanian/ChamorroGuatemalanGuyaneseHaitianHmongHonduranHopiHoumaHungarianIcelanderIndian (Asian)IndonesianInupiatIranianIraqiIrishIroquoisIsraeliItalianJamaicanJapaneseJordanianKenyanKiowaKoreanLaotianLatvianLebaneseLiberianLithuanianLumbeeLuxembourgerMacedonianMalaysianMalteseMarshalleseMenomineeMexicanMexican American IndianMongolianMoroccanNative HawaiianNavajoNepaleseNew ZealanderNicaraguanNigerianNorthern EuropeanNorwegianOkinawanOsageOttawaPaiutePakistaniPalestinianPanamanianParaguayanPennsylvania GermanPeruvianPimaPolishPortuguesePotawatomiPuebloPuerto RicanPuget Sound SalishRomanianRussianSalvadoranSamoanScandinavianScotch-IrishScottishSeminoleSenegaleseSerbianShoshoneSierra LeoneanSiouxSlavicSlovakSloveneSomaliSouth AfricanSouth AmericanSouth American IndianSoviet UnionSpaniardSpanishSpanish AmericanSpanish American IndianSri LankanSubsaharan AfricanSudaneseSwedishSwissSyrianTaiwaneseThaiTlingit-HaidaTohono O'OdhamTonganTrinidadian and TobagonianTsimshianTurkishU.S. Virgin IslanderUgandanUkrainianUruguayanUteVenezuelanVietnameseWelshYakamaYaquiYugoslavianYumanYup'ikZimbabwean
Immigration
NonimmigrantsImmigrantsAfghanistanAfricaAlbaniaArgentinaArmeniaAsiaAustraliaAustriaBahamasBangladeshBarbadosBelarusBelgiumBelizeBoliviaBosnia and HerzegovinaBrazilBulgariaBurma/MyanmarCabo VerdeCambodiaCameroonCanadaCaribbeanCentral AmericaChileChinaColombiaCongoCosta RicaCroatiaCubaCzechoslovakiaDenmarkDominicaDominican RepublicEastern AfricaEastern AsiaEastern EuropeEcuadorEgyptEl SalvadorEnglandEritreaEthiopiaEuropeFijiFranceGermanyGhanaGreeceGrenadaGuatemalaGuyanaHaitiHondurasHong KongHungaryIndiaIndonesiaIranIraqIrelandIsraelItalyJamaicaJapanJordanKazakhstanKenyaKoreaKuwaitLaosLatin AmericaLatviaLebanonLiberiaLithuaniaMalaysiaMexicoMicronesiaMiddle AfricaMoldovaMoroccoNepalNetherlandsNicaraguaNigeriaNorth AmericaNorth MacedoniaNorthern AfricaNorthern EuropeNorwayOceaniaPakistanPanamaPeruPhilippinesPolandPortugalRomaniaRussiaSaudi ArabiaScotlandSenegalSerbiaSierra LeoneSingaporeSomaliaSouth AfricaSouth AmericaSouth Central AsiaSouth Eastern AsiaSouthern EuropeSpainSri LankaSt. Vincent and the GrenadinesSudanSwedenSwitzerlandSyriaTaiwanThailandTrinidad and TobagoTurkeyUgandaUkraineUruguayUzbekistanVenezuelaVietnamWest IndiesWestern AfricaWestern AsiaWestern EuropeYemenZaireZimbabweAzores
West Indian
Race
Ancestry
AfghanAfricanAlaska NativeAlaskan AthabascanAlbanianAleutAlsatianAmericanApacheArabArapahoArgentineanArmenianAustralianAustrianBahamianBangladeshiBarbadianBasqueBelgianBelizeanBermudanBhutaneseBlackfeetBolivianBrazilianBritishBritish West IndianBulgarianBurmeseCajunCambodianCanadianCape VerdeanCarpatho RusynCelticCentral AmericanCentral American IndianCherokeeCheyenneChickasawChileanChineseChippewaChoctawColombianColvilleComancheCosta RicanCreeCreekCroatianCrowCubanCypriotCzechCzechoslovakianDanishDelawareDominicanDutchDutch West IndianEastern EuropeanEcuadorianEgyptianEnglishEstonianEthiopianEuropeanFijianFilipinoFinnishFrenchFrench American IndianFrench CanadianGermanGerman RussianGhanaianGreekGuamanian/ChamorroGuatemalanGuyaneseHaitianHmongHonduranHopiHoumaHungarianIcelanderIndian (Asian)IndonesianInupiatIranianIraqiIrishIroquoisIsraeliItalianJamaicanJapaneseJordanianKenyanKiowaKoreanLaotianLatvianLebaneseLiberianLithuanianLumbeeLuxembourgerMacedonianMalaysianMalteseMarshalleseMenomineeMexicanMexican American IndianMongolianMoroccanNative HawaiianNavajoNepaleseNew ZealanderNicaraguanNigerianNorthern EuropeanNorwegianOkinawanOsageOttawaPaiutePakistaniPalestinianPanamanianParaguayanPennsylvania GermanPeruvianPimaPolishPortuguesePotawatomiPuebloPuerto RicanPuget Sound SalishRomanianRussianSalvadoranSamoanScandinavianScotch-IrishScottishSeminoleSenegaleseSerbianShoshoneSierra LeoneanSiouxSlavicSlovakSloveneSomaliSouth AfricanSouth AmericanSouth American IndianSoviet UnionSpaniardSpanishSpanish AmericanSpanish American IndianSri LankanSubsaharan AfricanSudaneseSwedishSwissSyrianTaiwaneseThaiTlingit-HaidaTohono O'OdhamTonganTrinidadian and TobagonianTsimshianTurkishU.S. Virgin IslanderUgandanUkrainianUruguayanUteVenezuelanVietnameseWelshWest IndianYakamaYaquiYugoslavianYumanYup'ikZimbabwean
Immigration
NonimmigrantsImmigrantsAfghanistanAfricaAlbaniaArgentinaArmeniaAsiaAustraliaAustriaBahamasBangladeshBarbadosBelarusBelgiumBelizeBoliviaBosnia and HerzegovinaBrazilBulgariaBurma/MyanmarCabo VerdeCambodiaCameroonCanadaCaribbeanCentral AmericaChileChinaColombiaCongoCosta RicaCroatiaCubaCzechoslovakiaDenmarkDominicaDominican RepublicEastern AfricaEastern AsiaEastern EuropeEcuadorEgyptEl SalvadorEnglandEritreaEthiopiaEuropeFijiFranceGermanyGhanaGreeceGrenadaGuatemalaGuyanaHaitiHondurasHong KongHungaryIndiaIndonesiaIranIraqIrelandIsraelItalyJamaicaJapanJordanKazakhstanKenyaKoreaKuwaitLaosLatin AmericaLatviaLebanonLiberiaLithuaniaMalaysiaMexicoMicronesiaMiddle AfricaMoldovaMoroccoNepalNetherlandsNicaraguaNigeriaNorth AmericaNorth MacedoniaNorthern AfricaNorthern EuropeNorwayOceaniaPakistanPanamaPeruPhilippinesPolandPortugalRomaniaRussiaSaudi ArabiaScotlandSenegalSerbiaSierra LeoneSingaporeSomaliaSouth AfricaSouth AmericaSouth Central AsiaSouth Eastern AsiaSouthern EuropeSpainSri LankaSt. Vincent and the GrenadinesSudanSwedenSwitzerlandSyriaTaiwanThailandTrinidad and TobagoTurkeyUgandaUkraineUruguayUzbekistanVenezuelaVietnamWest IndiesWestern AfricaWestern AsiaWestern EuropeYemenZaireZimbabweAzores
Single Mother Households
Income
Poverty
Unemployment
Labor Participation
Family Structure
Vehicle Availability
Education Level
Disability

Single Mother Households Comparison

Assyrians/Chaldeans/Syriacs

West Indians

Exceptional
Tragic
4.8%
SINGLE MOTHER HOUSEHOLDS
100.0/ 100
METRIC RATING
4th/ 347
METRIC RANK
7.8%
SINGLE MOTHER HOUSEHOLDS
0.0/ 100
METRIC RATING
291st/ 347
METRIC RANK

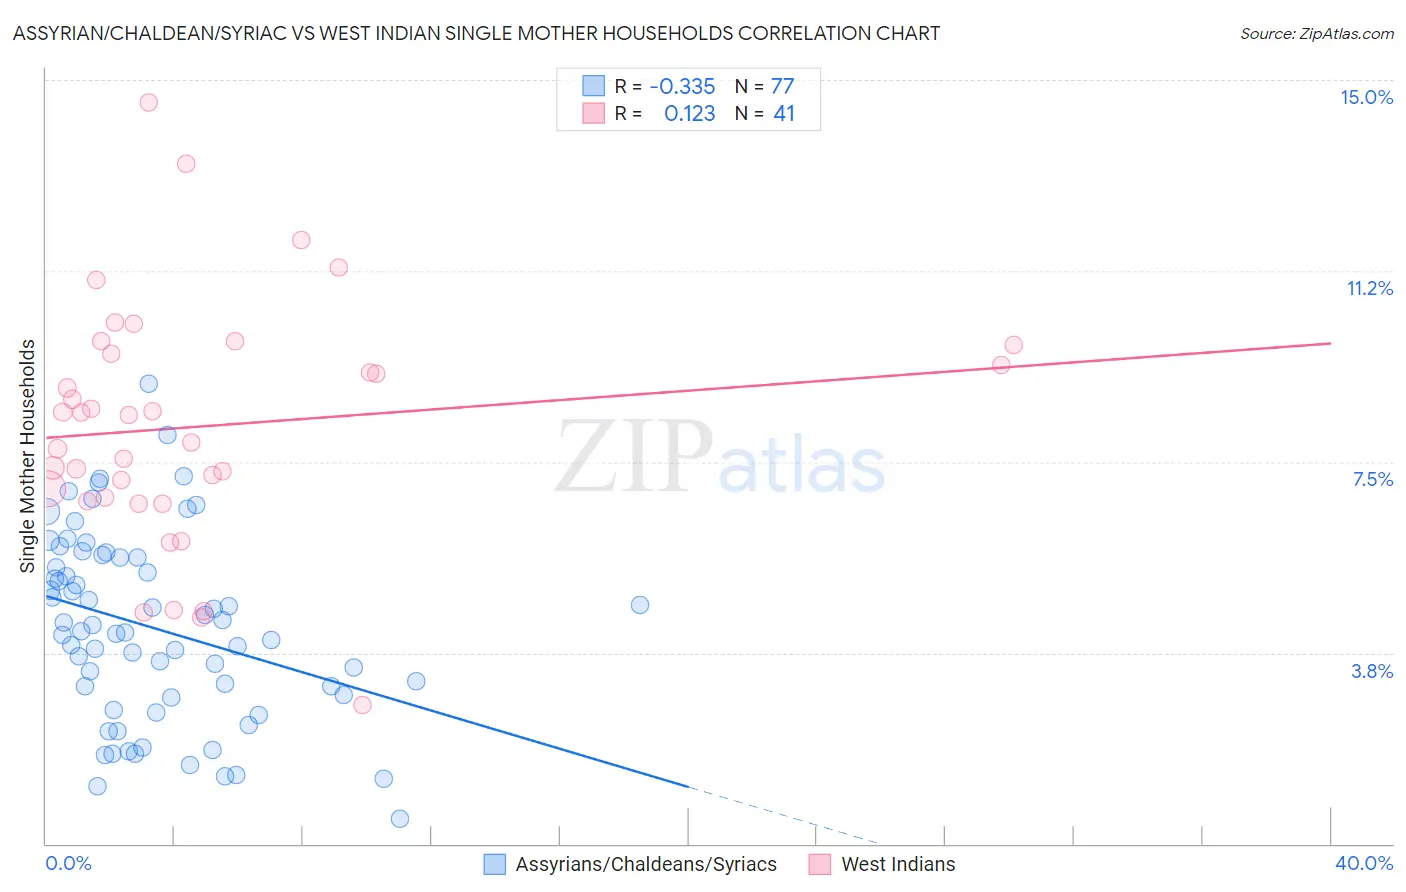
Assyrian/Chaldean/Syriac vs West Indian Single Mother Households Correlation Chart

The statistical analysis conducted on geographies consisting of 110,241,669 people shows a mild negative correlation between the proportion of Assyrians/Chaldeans/Syriacs and percentage of single mother households in the United States with a correlation coefficient (R) of -0.335 and weighted average of 4.8%. Similarly, the statistical analysis conducted on geographies consisting of 253,636,712 people shows a poor positive correlation between the proportion of West Indians and percentage of single mother households in the United States with a correlation coefficient (R) of 0.123 and weighted average of 7.8%, a difference of 63.1%.
Assyrian/Chaldean/Syriac vs West Indian Single Mother Households

Single Mother Households Correlation Summary

MeasurementAssyrian/Chaldean/SyriacWest Indian
Minimum0.50%2.7%
Maximum9.0%14.6%
Range8.5%11.8%
Mean4.2%8.2%
Median4.2%8.4%
Interquartile 25% (IQ1)2.9%6.8%
Interquartile 75% (IQ3)5.6%9.7%
Interquartile Range (IQR)2.7%2.9%
Standard Deviation (Sample)1.8%2.4%
Standard Deviation (Population)1.8%2.4%

Similar Demographics by Single Mother Households

Demographics Similar to Assyrians/Chaldeans/Syriacs by Single Mother Households

In terms of single mother households, the demographic groups most similar to Assyrians/Chaldeans/Syriacs are Immigrants from Iran (4.8%, a difference of 0.080%), Immigrants from Hong Kong (4.8%, a difference of 0.52%), Filipino (4.7%, a difference of 2.4%), Immigrants from Taiwan (4.7%, a difference of 2.7%), and Immigrants from Singapore (5.0%, a difference of 3.1%).
DemographicsRating | RankSingle Mother Households
Immigrants | Taiwan
100.0
/100
|
#1
Exceptional
4.7%
Filipinos
100.0
/100
|
#2
Exceptional
4.7%
Immigrants | Iran
100.0
/100
|
#3
Exceptional
4.8%
Assyrians/Chaldeans/Syriacs
100.0
/100
|
#4
Exceptional
4.8%
Immigrants | Hong Kong
100.0
/100
|
#5
Exceptional
4.8%
Immigrants | Singapore
100.0
/100
|
#6
Exceptional
5.0%
Iranians
100.0
/100
|
#7
Exceptional
5.0%
Immigrants | Ireland
99.9
/100
|
#8
Exceptional
5.0%
Okinawans
99.9
/100
|
#9
Exceptional
5.0%
Immigrants | Israel
99.9
/100
|
#10
Exceptional
5.0%
Immigrants | China
99.9
/100
|
#11
Exceptional
5.1%
Cypriots
99.9
/100
|
#12
Exceptional
5.1%
Immigrants | India
99.9
/100
|
#13
Exceptional
5.1%
Immigrants | Australia
99.9
/100
|
#14
Exceptional
5.1%
Immigrants | Eastern Asia
99.9
/100
|
#15
Exceptional
5.1%

Demographics Similar to West Indians by Single Mother Households

In terms of single mother households, the demographic groups most similar to West Indians are Ghanaian (7.8%, a difference of 0.010%), Immigrants from Nigeria (7.8%, a difference of 0.080%), Immigrants from Cameroon (7.9%, a difference of 0.37%), Apache (7.9%, a difference of 0.47%), and Subsaharan African (7.8%, a difference of 0.50%).
DemographicsRating | RankSingle Mother Households
Immigrants | Belize
0.0
/100
|
#284
Tragic
7.7%
Trinidadians and Tobagonians
0.0
/100
|
#285
Tragic
7.7%
Immigrants | Middle Africa
0.0
/100
|
#286
Tragic
7.7%
Immigrants | Guatemala
0.0
/100
|
#287
Tragic
7.7%
Sierra Leoneans
0.0
/100
|
#288
Tragic
7.7%
Sub-Saharan Africans
0.0
/100
|
#289
Tragic
7.8%
Immigrants | Nigeria
0.0
/100
|
#290
Tragic
7.8%
West Indians
0.0
/100
|
#291
Tragic
7.8%
Ghanaians
0.0
/100
|
#292
Tragic
7.8%
Immigrants | Cameroon
0.0
/100
|
#293
Tragic
7.9%
Apache
0.0
/100
|
#294
Tragic
7.9%
Barbadians
0.0
/100
|
#295
Tragic
7.9%
Immigrants | Latin America
0.0
/100
|
#296
Tragic
7.9%
Hispanics or Latinos
0.0
/100
|
#297
Tragic
7.9%
Immigrants | West Indies
0.0
/100
|
#298
Tragic
7.9%