Assyrian/Chaldean/Syriac vs Swedish Single Mother Households
COMPARE
Assyrian/Chaldean/Syriac
Swedish
Single Mother Households
Single Mother Households Comparison
Assyrians/Chaldeans/Syriacs
Swedes
4.8%
SINGLE MOTHER HOUSEHOLDS
100.0/ 100
METRIC RATING
4th/ 347
METRIC RANK
5.5%
SINGLE MOTHER HOUSEHOLDS
99.1/ 100
METRIC RATING
52nd/ 347
METRIC RANK
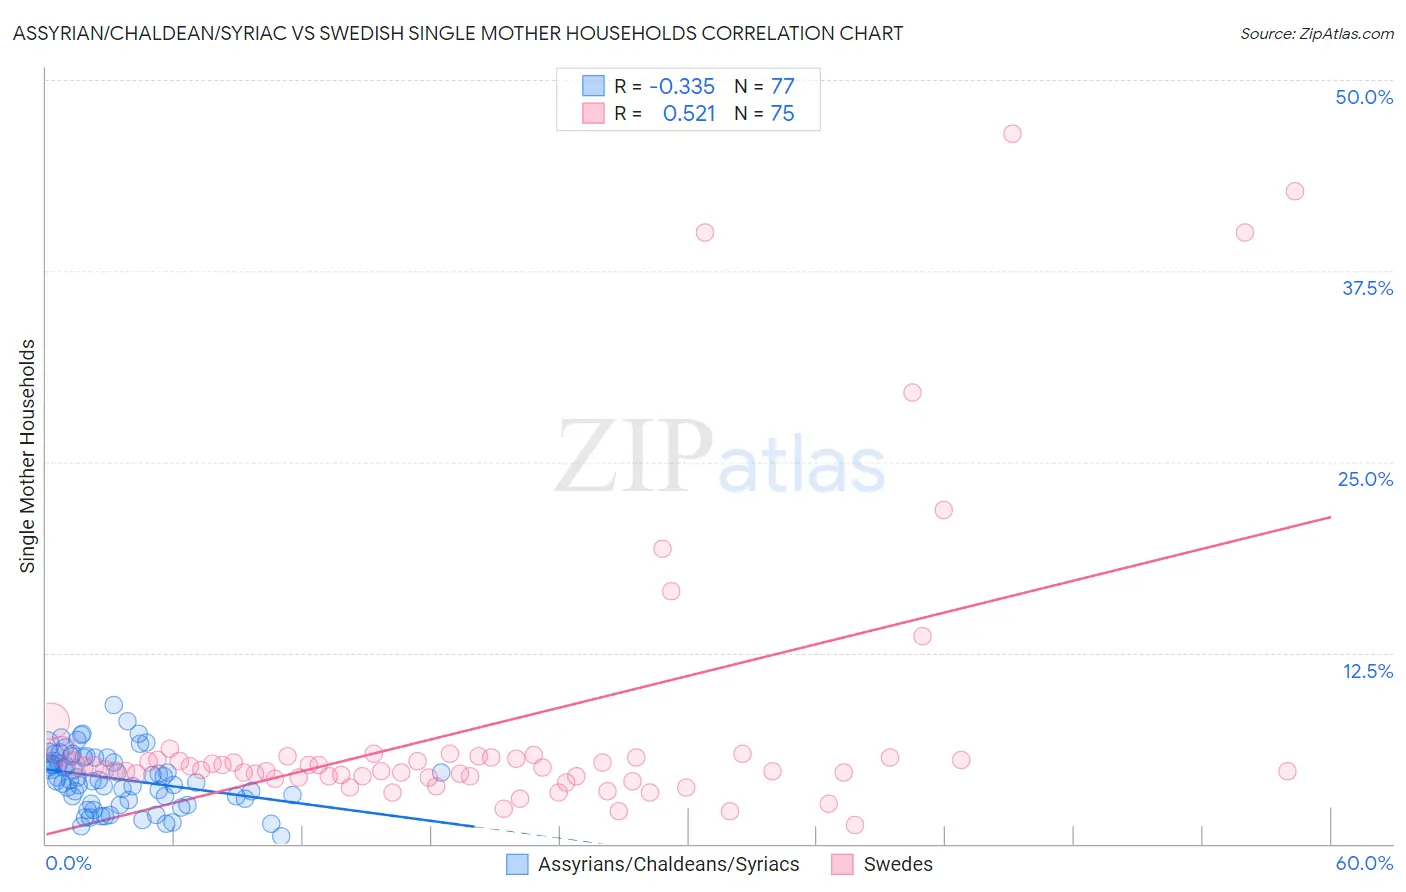
Assyrian/Chaldean/Syriac vs Swedish Single Mother Households Correlation Chart
The statistical analysis conducted on geographies consisting of 110,241,669 people shows a mild negative correlation between the proportion of Assyrians/Chaldeans/Syriacs and percentage of single mother households in the United States with a correlation coefficient (R) of -0.335 and weighted average of 4.8%. Similarly, the statistical analysis conducted on geographies consisting of 535,069,304 people shows a substantial positive correlation between the proportion of Swedes and percentage of single mother households in the United States with a correlation coefficient (R) of 0.521 and weighted average of 5.5%, a difference of 14.2%.
Single Mother Households Correlation Summary
| Measurement | Assyrian/Chaldean/Syriac | Swedish |
| Minimum | 0.50% | 1.3% |
| Maximum | 9.0% | 46.5% |
| Range | 8.5% | 45.2% |
| Mean | 4.2% | 7.7% |
| Median | 4.2% | 5.0% |
| Interquartile 25% (IQ1) | 2.9% | 4.4% |
| Interquartile 75% (IQ3) | 5.6% | 5.7% |
| Interquartile Range (IQR) | 2.7% | 1.3% |
| Standard Deviation (Sample) | 1.8% | 9.3% |
| Standard Deviation (Population) | 1.8% | 9.3% |
Similar Demographics by Single Mother Households
Demographics Similar to Assyrians/Chaldeans/Syriacs by Single Mother Households
In terms of single mother households, the demographic groups most similar to Assyrians/Chaldeans/Syriacs are Immigrants from Iran (4.8%, a difference of 0.080%), Immigrants from Hong Kong (4.8%, a difference of 0.52%), Filipino (4.7%, a difference of 2.4%), Immigrants from Taiwan (4.7%, a difference of 2.7%), and Immigrants from Singapore (5.0%, a difference of 3.1%).
| Demographics | Rating | Rank | Single Mother Households |
| Immigrants | Taiwan | 100.0 /100 | #1 | Exceptional 4.7% |
| Filipinos | 100.0 /100 | #2 | Exceptional 4.7% |
| Immigrants | Iran | 100.0 /100 | #3 | Exceptional 4.8% |
| Assyrians/Chaldeans/Syriacs | 100.0 /100 | #4 | Exceptional 4.8% |
| Immigrants | Hong Kong | 100.0 /100 | #5 | Exceptional 4.8% |
| Immigrants | Singapore | 100.0 /100 | #6 | Exceptional 5.0% |
| Iranians | 100.0 /100 | #7 | Exceptional 5.0% |
| Immigrants | Ireland | 99.9 /100 | #8 | Exceptional 5.0% |
| Okinawans | 99.9 /100 | #9 | Exceptional 5.0% |
| Immigrants | Israel | 99.9 /100 | #10 | Exceptional 5.0% |
| Immigrants | China | 99.9 /100 | #11 | Exceptional 5.1% |
| Cypriots | 99.9 /100 | #12 | Exceptional 5.1% |
| Immigrants | India | 99.9 /100 | #13 | Exceptional 5.1% |
| Immigrants | Australia | 99.9 /100 | #14 | Exceptional 5.1% |
| Immigrants | Eastern Asia | 99.9 /100 | #15 | Exceptional 5.1% |
Demographics Similar to Swedes by Single Mother Households
In terms of single mother households, the demographic groups most similar to Swedes are Immigrants from Belarus (5.5%, a difference of 0.070%), Immigrants from Scotland (5.5%, a difference of 0.080%), Immigrants from Russia (5.5%, a difference of 0.10%), Immigrants from Lebanon (5.5%, a difference of 0.12%), and Immigrants from Latvia (5.5%, a difference of 0.27%).
| Demographics | Rating | Rank | Single Mother Households |
| Immigrants | Croatia | 99.4 /100 | #45 | Exceptional 5.4% |
| Croatians | 99.3 /100 | #46 | Exceptional 5.5% |
| Norwegians | 99.3 /100 | #47 | Exceptional 5.5% |
| Turks | 99.2 /100 | #48 | Exceptional 5.5% |
| Immigrants | Latvia | 99.2 /100 | #49 | Exceptional 5.5% |
| Immigrants | Scotland | 99.2 /100 | #50 | Exceptional 5.5% |
| Immigrants | Belarus | 99.2 /100 | #51 | Exceptional 5.5% |
| Swedes | 99.1 /100 | #52 | Exceptional 5.5% |
| Immigrants | Russia | 99.1 /100 | #53 | Exceptional 5.5% |
| Immigrants | Lebanon | 99.1 /100 | #54 | Exceptional 5.5% |
| Immigrants | Denmark | 99.1 /100 | #55 | Exceptional 5.5% |
| Immigrants | Romania | 99.0 /100 | #56 | Exceptional 5.5% |
| Immigrants | Europe | 99.0 /100 | #57 | Exceptional 5.5% |
| Danes | 98.9 /100 | #58 | Exceptional 5.5% |
| Luxembourgers | 98.7 /100 | #59 | Exceptional 5.6% |