Assyrian/Chaldean/Syriac vs Immigrants from Lithuania Single Mother Households

COMPARE

Assyrian/Chaldean/Syriac
Race
Ancestry
AfghanAfricanAlaska NativeAlaskan AthabascanAlbanianAleutAlsatianAmericanApacheArabArapahoArgentineanArmenianAssyrian/Chaldean/SyriacAustralianAustrianBahamianBangladeshiBarbadianBasqueBelgianBelizeanBermudanBhutaneseBlackfeetBolivianBrazilianBritishBritish West IndianBulgarianBurmeseCajunCambodianCanadianCape VerdeanCarpatho RusynCelticCentral AmericanCentral American IndianCherokeeCheyenneChickasawChileanChineseChippewaChoctawColombianColvilleComancheCosta RicanCreeCreekCroatianCrowCubanCypriotCzechCzechoslovakianDanishDelawareDominicanDutchDutch West IndianEastern EuropeanEcuadorianEgyptianEnglishEstonianEthiopianEuropeanFijianFilipinoFinnishFrenchFrench American IndianFrench CanadianGermanGerman RussianGhanaianGreekGuamanian/ChamorroGuatemalanGuyaneseHaitianHmongHonduranHopiHoumaHungarianIcelanderIndian (Asian)IndonesianInupiatIranianIraqiIrishIroquoisIsraeliItalianJamaicanJapaneseJordanianKenyanKiowaKoreanLaotianLatvianLebaneseLiberianLithuanianLumbeeLuxembourgerMacedonianMalaysianMalteseMarshalleseMenomineeMexicanMexican American IndianMongolianMoroccanNative HawaiianNavajoNepaleseNew ZealanderNicaraguanNigerianNorthern EuropeanNorwegianOkinawanOsageOttawaPaiutePakistaniPalestinianPanamanianParaguayanPennsylvania GermanPeruvianPimaPolishPortuguesePotawatomiPuebloPuerto RicanPuget Sound SalishRomanianRussianSalvadoranSamoanScandinavianScotch-IrishScottishSeminoleSenegaleseSerbianShoshoneSierra LeoneanSiouxSlavicSlovakSloveneSomaliSouth AfricanSouth AmericanSouth American IndianSoviet UnionSpaniardSpanishSpanish AmericanSpanish American IndianSri LankanSubsaharan AfricanSudaneseSwedishSwissSyrianTaiwaneseThaiTlingit-HaidaTohono O'OdhamTonganTrinidadian and TobagonianTsimshianTurkishU.S. Virgin IslanderUgandanUkrainianUruguayanUteVenezuelanVietnameseWelshWest IndianYakamaYaquiYugoslavianYumanYup'ikZimbabwean
Immigration
NonimmigrantsImmigrantsAfghanistanAfricaAlbaniaArgentinaArmeniaAsiaAustraliaAustriaBahamasBangladeshBarbadosBelarusBelgiumBelizeBoliviaBosnia and HerzegovinaBrazilBulgariaBurma/MyanmarCabo VerdeCambodiaCameroonCanadaCaribbeanCentral AmericaChileChinaColombiaCongoCosta RicaCroatiaCubaCzechoslovakiaDenmarkDominicaDominican RepublicEastern AfricaEastern AsiaEastern EuropeEcuadorEgyptEl SalvadorEnglandEritreaEthiopiaEuropeFijiFranceGermanyGhanaGreeceGrenadaGuatemalaGuyanaHaitiHondurasHong KongHungaryIndiaIndonesiaIranIraqIrelandIsraelItalyJamaicaJapanJordanKazakhstanKenyaKoreaKuwaitLaosLatin AmericaLatviaLebanonLiberiaMalaysiaMexicoMicronesiaMiddle AfricaMoldovaMoroccoNepalNetherlandsNicaraguaNigeriaNorth AmericaNorth MacedoniaNorthern AfricaNorthern EuropeNorwayOceaniaPakistanPanamaPeruPhilippinesPolandPortugalRomaniaRussiaSaudi ArabiaScotlandSenegalSerbiaSierra LeoneSingaporeSomaliaSouth AfricaSouth AmericaSouth Central AsiaSouth Eastern AsiaSouthern EuropeSpainSri LankaSt. Vincent and the GrenadinesSudanSwedenSwitzerlandSyriaTaiwanThailandTrinidad and TobagoTurkeyUgandaUkraineUruguayUzbekistanVenezuelaVietnamWest IndiesWestern AfricaWestern AsiaWestern EuropeYemenZaireZimbabweAzores
Immigrants from Lithuania
Race
Ancestry
AfghanAfricanAlaska NativeAlaskan AthabascanAlbanianAleutAlsatianAmericanApacheArabArapahoArgentineanArmenianAustralianAustrianBahamianBangladeshiBarbadianBasqueBelgianBelizeanBermudanBhutaneseBlackfeetBolivianBrazilianBritishBritish West IndianBulgarianBurmeseCajunCambodianCanadianCape VerdeanCarpatho RusynCelticCentral AmericanCentral American IndianCherokeeCheyenneChickasawChileanChineseChippewaChoctawColombianColvilleComancheCosta RicanCreeCreekCroatianCrowCubanCypriotCzechCzechoslovakianDanishDelawareDominicanDutchDutch West IndianEastern EuropeanEcuadorianEgyptianEnglishEstonianEthiopianEuropeanFijianFilipinoFinnishFrenchFrench American IndianFrench CanadianGermanGerman RussianGhanaianGreekGuamanian/ChamorroGuatemalanGuyaneseHaitianHmongHonduranHopiHoumaHungarianIcelanderIndian (Asian)IndonesianInupiatIranianIraqiIrishIroquoisIsraeliItalianJamaicanJapaneseJordanianKenyanKiowaKoreanLaotianLatvianLebaneseLiberianLithuanianLumbeeLuxembourgerMacedonianMalaysianMalteseMarshalleseMenomineeMexicanMexican American IndianMongolianMoroccanNative HawaiianNavajoNepaleseNew ZealanderNicaraguanNigerianNorthern EuropeanNorwegianOkinawanOsageOttawaPaiutePakistaniPalestinianPanamanianParaguayanPennsylvania GermanPeruvianPimaPolishPortuguesePotawatomiPuebloPuerto RicanPuget Sound SalishRomanianRussianSalvadoranSamoanScandinavianScotch-IrishScottishSeminoleSenegaleseSerbianShoshoneSierra LeoneanSiouxSlavicSlovakSloveneSomaliSouth AfricanSouth AmericanSouth American IndianSoviet UnionSpaniardSpanishSpanish AmericanSpanish American IndianSri LankanSubsaharan AfricanSudaneseSwedishSwissSyrianTaiwaneseThaiTlingit-HaidaTohono O'OdhamTonganTrinidadian and TobagonianTsimshianTurkishU.S. Virgin IslanderUgandanUkrainianUruguayanUteVenezuelanVietnameseWelshWest IndianYakamaYaquiYugoslavianYumanYup'ikZimbabwean
Immigration
NonimmigrantsImmigrantsAfghanistanAfricaAlbaniaArgentinaArmeniaAsiaAustraliaAustriaBahamasBangladeshBarbadosBelarusBelgiumBelizeBoliviaBosnia and HerzegovinaBrazilBulgariaBurma/MyanmarCabo VerdeCambodiaCameroonCanadaCaribbeanCentral AmericaChileChinaColombiaCongoCosta RicaCroatiaCubaCzechoslovakiaDenmarkDominicaDominican RepublicEastern AfricaEastern AsiaEastern EuropeEcuadorEgyptEl SalvadorEnglandEritreaEthiopiaEuropeFijiFranceGermanyGhanaGreeceGrenadaGuatemalaGuyanaHaitiHondurasHong KongHungaryIndiaIndonesiaIranIraqIrelandIsraelItalyJamaicaJapanJordanKazakhstanKenyaKoreaKuwaitLaosLatin AmericaLatviaLebanonLiberiaLithuaniaMalaysiaMexicoMicronesiaMiddle AfricaMoldovaMoroccoNepalNetherlandsNicaraguaNigeriaNorth AmericaNorth MacedoniaNorthern AfricaNorthern EuropeNorwayOceaniaPakistanPanamaPeruPhilippinesPolandPortugalRomaniaRussiaSaudi ArabiaScotlandSenegalSerbiaSierra LeoneSingaporeSomaliaSouth AfricaSouth AmericaSouth Central AsiaSouth Eastern AsiaSouthern EuropeSpainSri LankaSt. Vincent and the GrenadinesSudanSwedenSwitzerlandSyriaTaiwanThailandTrinidad and TobagoTurkeyUgandaUkraineUruguayUzbekistanVenezuelaVietnamWest IndiesWestern AfricaWestern AsiaWestern EuropeYemenZaireZimbabweAzores
Single Mother Households
Income
Poverty
Unemployment
Labor Participation
Family Structure
Vehicle Availability
Education Level
Disability

Single Mother Households Comparison

Assyrians/Chaldeans/Syriacs

Immigrants from Lithuania

Exceptional
Exceptional
4.8%
SINGLE MOTHER HOUSEHOLDS
100.0/ 100
METRIC RATING
4th/ 347
METRIC RANK
5.3%
SINGLE MOTHER HOUSEHOLDS
99.8/ 100
METRIC RATING
26th/ 347
METRIC RANK

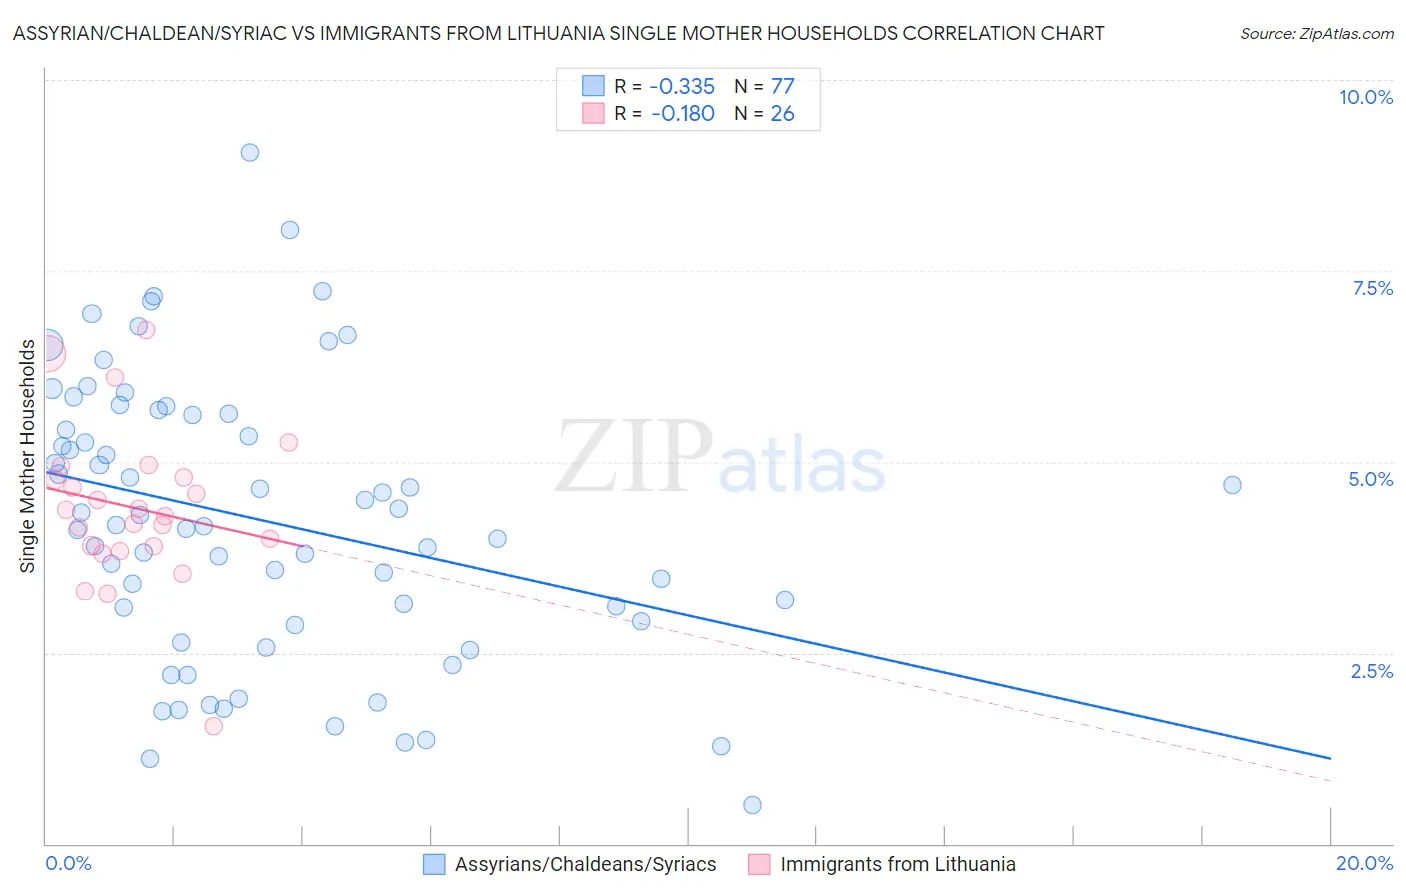
Assyrian/Chaldean/Syriac vs Immigrants from Lithuania Single Mother Households Correlation Chart

The statistical analysis conducted on geographies consisting of 110,241,669 people shows a mild negative correlation between the proportion of Assyrians/Chaldeans/Syriacs and percentage of single mother households in the United States with a correlation coefficient (R) of -0.335 and weighted average of 4.8%. Similarly, the statistical analysis conducted on geographies consisting of 117,657,172 people shows a poor negative correlation between the proportion of Immigrants from Lithuania and percentage of single mother households in the United States with a correlation coefficient (R) of -0.180 and weighted average of 5.3%, a difference of 9.2%.
Assyrian/Chaldean/Syriac vs Immigrants from Lithuania Single Mother Households

Single Mother Households Correlation Summary

MeasurementAssyrian/Chaldean/SyriacImmigrants from Lithuania
Minimum0.50%1.5%
Maximum9.0%6.7%
Range8.5%5.2%
Mean4.2%4.4%
Median4.2%4.3%
Interquartile 25% (IQ1)2.9%3.9%
Interquartile 75% (IQ3)5.6%4.8%
Interquartile Range (IQR)2.7%0.89%
Standard Deviation (Sample)1.8%1.0%
Standard Deviation (Population)1.8%1.0%

Similar Demographics by Single Mother Households

Demographics Similar to Assyrians/Chaldeans/Syriacs by Single Mother Households

In terms of single mother households, the demographic groups most similar to Assyrians/Chaldeans/Syriacs are Immigrants from Iran (4.8%, a difference of 0.080%), Immigrants from Hong Kong (4.8%, a difference of 0.52%), Filipino (4.7%, a difference of 2.4%), Immigrants from Taiwan (4.7%, a difference of 2.7%), and Immigrants from Singapore (5.0%, a difference of 3.1%).
DemographicsRating | RankSingle Mother Households
Immigrants | Taiwan
100.0
/100
|
#1
Exceptional
4.7%
Filipinos
100.0
/100
|
#2
Exceptional
4.7%
Immigrants | Iran
100.0
/100
|
#3
Exceptional
4.8%
Assyrians/Chaldeans/Syriacs
100.0
/100
|
#4
Exceptional
4.8%
Immigrants | Hong Kong
100.0
/100
|
#5
Exceptional
4.8%
Immigrants | Singapore
100.0
/100
|
#6
Exceptional
5.0%
Iranians
100.0
/100
|
#7
Exceptional
5.0%
Immigrants | Ireland
99.9
/100
|
#8
Exceptional
5.0%
Okinawans
99.9
/100
|
#9
Exceptional
5.0%
Immigrants | Israel
99.9
/100
|
#10
Exceptional
5.0%
Immigrants | China
99.9
/100
|
#11
Exceptional
5.1%
Cypriots
99.9
/100
|
#12
Exceptional
5.1%
Immigrants | India
99.9
/100
|
#13
Exceptional
5.1%
Immigrants | Australia
99.9
/100
|
#14
Exceptional
5.1%
Immigrants | Eastern Asia
99.9
/100
|
#15
Exceptional
5.1%

Demographics Similar to Immigrants from Lithuania by Single Mother Households

In terms of single mother households, the demographic groups most similar to Immigrants from Lithuania are Immigrants from Japan (5.2%, a difference of 0.030%), Armenian (5.2%, a difference of 0.36%), Immigrants from Austria (5.2%, a difference of 0.42%), Thai (5.2%, a difference of 0.47%), and Bhutanese (5.3%, a difference of 0.51%).
DemographicsRating | RankSingle Mother Households
Chinese
99.9
/100
|
#19
Exceptional
5.2%
Maltese
99.9
/100
|
#20
Exceptional
5.2%
Eastern Europeans
99.8
/100
|
#21
Exceptional
5.2%
Thais
99.8
/100
|
#22
Exceptional
5.2%
Immigrants | Austria
99.8
/100
|
#23
Exceptional
5.2%
Armenians
99.8
/100
|
#24
Exceptional
5.2%
Immigrants | Japan
99.8
/100
|
#25
Exceptional
5.2%
Immigrants | Lithuania
99.8
/100
|
#26
Exceptional
5.3%
Bhutanese
99.7
/100
|
#27
Exceptional
5.3%
Russians
99.7
/100
|
#28
Exceptional
5.3%
Latvians
99.7
/100
|
#29
Exceptional
5.3%
Burmese
99.7
/100
|
#30
Exceptional
5.3%
Immigrants | Korea
99.7
/100
|
#31
Exceptional
5.3%
Cambodians
99.7
/100
|
#32
Exceptional
5.3%
Immigrants | Switzerland
99.7
/100
|
#33
Exceptional
5.3%