Assyrian/Chaldean/Syriac vs African Single Mother Households

COMPARE

Assyrian/Chaldean/Syriac
Race
Ancestry
AfghanAlaska NativeAlaskan AthabascanAlbanianAleutAlsatianAmericanApacheArabArapahoArgentineanArmenianAssyrian/Chaldean/SyriacAustralianAustrianBahamianBangladeshiBarbadianBasqueBelgianBelizeanBermudanBhutaneseBlackfeetBolivianBrazilianBritishBritish West IndianBulgarianBurmeseCajunCambodianCanadianCape VerdeanCarpatho RusynCelticCentral AmericanCentral American IndianCherokeeCheyenneChickasawChileanChineseChippewaChoctawColombianColvilleComancheCosta RicanCreeCreekCroatianCrowCubanCypriotCzechCzechoslovakianDanishDelawareDominicanDutchDutch West IndianEastern EuropeanEcuadorianEgyptianEnglishEstonianEthiopianEuropeanFijianFilipinoFinnishFrenchFrench American IndianFrench CanadianGermanGerman RussianGhanaianGreekGuamanian/ChamorroGuatemalanGuyaneseHaitianHmongHonduranHopiHoumaHungarianIcelanderIndian (Asian)IndonesianInupiatIranianIraqiIrishIroquoisIsraeliItalianJamaicanJapaneseJordanianKenyanKiowaKoreanLaotianLatvianLebaneseLiberianLithuanianLumbeeLuxembourgerMacedonianMalaysianMalteseMarshalleseMenomineeMexicanMexican American IndianMongolianMoroccanNative HawaiianNavajoNepaleseNew ZealanderNicaraguanNigerianNorthern EuropeanNorwegianOkinawanOsageOttawaPaiutePakistaniPalestinianPanamanianParaguayanPennsylvania GermanPeruvianPimaPolishPortuguesePotawatomiPuebloPuerto RicanPuget Sound SalishRomanianRussianSalvadoranSamoanScandinavianScotch-IrishScottishSeminoleSenegaleseSerbianShoshoneSierra LeoneanSiouxSlavicSlovakSloveneSomaliSouth AfricanSouth AmericanSouth American IndianSoviet UnionSpaniardSpanishSpanish AmericanSpanish American IndianSri LankanSubsaharan AfricanSudaneseSwedishSwissSyrianTaiwaneseThaiTlingit-HaidaTohono O'OdhamTonganTrinidadian and TobagonianTsimshianTurkishU.S. Virgin IslanderUgandanUkrainianUruguayanUteVenezuelanVietnameseWelshWest IndianYakamaYaquiYugoslavianYumanYup'ikZimbabwean
Immigration
NonimmigrantsImmigrantsAfghanistanAfricaAlbaniaArgentinaArmeniaAsiaAustraliaAustriaBahamasBangladeshBarbadosBelarusBelgiumBelizeBoliviaBosnia and HerzegovinaBrazilBulgariaBurma/MyanmarCabo VerdeCambodiaCameroonCanadaCaribbeanCentral AmericaChileChinaColombiaCongoCosta RicaCroatiaCubaCzechoslovakiaDenmarkDominicaDominican RepublicEastern AfricaEastern AsiaEastern EuropeEcuadorEgyptEl SalvadorEnglandEritreaEthiopiaEuropeFijiFranceGermanyGhanaGreeceGrenadaGuatemalaGuyanaHaitiHondurasHong KongHungaryIndiaIndonesiaIranIraqIrelandIsraelItalyJamaicaJapanJordanKazakhstanKenyaKoreaKuwaitLaosLatin AmericaLatviaLebanonLiberiaLithuaniaMalaysiaMexicoMicronesiaMiddle AfricaMoldovaMoroccoNepalNetherlandsNicaraguaNigeriaNorth AmericaNorth MacedoniaNorthern AfricaNorthern EuropeNorwayOceaniaPakistanPanamaPeruPhilippinesPolandPortugalRomaniaRussiaSaudi ArabiaScotlandSenegalSerbiaSierra LeoneSingaporeSomaliaSouth AfricaSouth AmericaSouth Central AsiaSouth Eastern AsiaSouthern EuropeSpainSri LankaSt. Vincent and the GrenadinesSudanSwedenSwitzerlandSyriaTaiwanThailandTrinidad and TobagoTurkeyUgandaUkraineUruguayUzbekistanVenezuelaVietnamWest IndiesWestern AfricaWestern AsiaWestern EuropeYemenZaireZimbabweAzores
African
Race
Ancestry
AfghanAfricanAlaska NativeAlaskan AthabascanAlbanianAleutAlsatianAmericanApacheArabArapahoArgentineanArmenianAustralianAustrianBahamianBangladeshiBarbadianBasqueBelgianBelizeanBermudanBhutaneseBlackfeetBolivianBrazilianBritishBritish West IndianBulgarianBurmeseCajunCambodianCanadianCape VerdeanCarpatho RusynCelticCentral AmericanCentral American IndianCherokeeCheyenneChickasawChileanChineseChippewaChoctawColombianColvilleComancheCosta RicanCreeCreekCroatianCrowCubanCypriotCzechCzechoslovakianDanishDelawareDominicanDutchDutch West IndianEastern EuropeanEcuadorianEgyptianEnglishEstonianEthiopianEuropeanFijianFilipinoFinnishFrenchFrench American IndianFrench CanadianGermanGerman RussianGhanaianGreekGuamanian/ChamorroGuatemalanGuyaneseHaitianHmongHonduranHopiHoumaHungarianIcelanderIndian (Asian)IndonesianInupiatIranianIraqiIrishIroquoisIsraeliItalianJamaicanJapaneseJordanianKenyanKiowaKoreanLaotianLatvianLebaneseLiberianLithuanianLumbeeLuxembourgerMacedonianMalaysianMalteseMarshalleseMenomineeMexicanMexican American IndianMongolianMoroccanNative HawaiianNavajoNepaleseNew ZealanderNicaraguanNigerianNorthern EuropeanNorwegianOkinawanOsageOttawaPaiutePakistaniPalestinianPanamanianParaguayanPennsylvania GermanPeruvianPimaPolishPortuguesePotawatomiPuebloPuerto RicanPuget Sound SalishRomanianRussianSalvadoranSamoanScandinavianScotch-IrishScottishSeminoleSenegaleseSerbianShoshoneSierra LeoneanSiouxSlavicSlovakSloveneSomaliSouth AfricanSouth AmericanSouth American IndianSoviet UnionSpaniardSpanishSpanish AmericanSpanish American IndianSri LankanSubsaharan AfricanSudaneseSwedishSwissSyrianTaiwaneseThaiTlingit-HaidaTohono O'OdhamTonganTrinidadian and TobagonianTsimshianTurkishU.S. Virgin IslanderUgandanUkrainianUruguayanUteVenezuelanVietnameseWelshWest IndianYakamaYaquiYugoslavianYumanYup'ikZimbabwean
Immigration
NonimmigrantsImmigrantsAfghanistanAfricaAlbaniaArgentinaArmeniaAsiaAustraliaAustriaBahamasBangladeshBarbadosBelarusBelgiumBelizeBoliviaBosnia and HerzegovinaBrazilBulgariaBurma/MyanmarCabo VerdeCambodiaCameroonCanadaCaribbeanCentral AmericaChileChinaColombiaCongoCosta RicaCroatiaCubaCzechoslovakiaDenmarkDominicaDominican RepublicEastern AfricaEastern AsiaEastern EuropeEcuadorEgyptEl SalvadorEnglandEritreaEthiopiaEuropeFijiFranceGermanyGhanaGreeceGrenadaGuatemalaGuyanaHaitiHondurasHong KongHungaryIndiaIndonesiaIranIraqIrelandIsraelItalyJamaicaJapanJordanKazakhstanKenyaKoreaKuwaitLaosLatin AmericaLatviaLebanonLiberiaLithuaniaMalaysiaMexicoMicronesiaMiddle AfricaMoldovaMoroccoNepalNetherlandsNicaraguaNigeriaNorth AmericaNorth MacedoniaNorthern AfricaNorthern EuropeNorwayOceaniaPakistanPanamaPeruPhilippinesPolandPortugalRomaniaRussiaSaudi ArabiaScotlandSenegalSerbiaSierra LeoneSingaporeSomaliaSouth AfricaSouth AmericaSouth Central AsiaSouth Eastern AsiaSouthern EuropeSpainSri LankaSt. Vincent and the GrenadinesSudanSwedenSwitzerlandSyriaTaiwanThailandTrinidad and TobagoTurkeyUgandaUkraineUruguayUzbekistanVenezuelaVietnamWest IndiesWestern AfricaWestern AsiaWestern EuropeYemenZaireZimbabweAzores
Single Mother Households
Income
Poverty
Unemployment
Labor Participation
Family Structure
Vehicle Availability
Education Level
Disability

Single Mother Households Comparison

Assyrians/Chaldeans/Syriacs

Africans

Exceptional
Tragic
4.8%
SINGLE MOTHER HOUSEHOLDS
100.0/ 100
METRIC RATING
4th/ 347
METRIC RANK
8.2%
SINGLE MOTHER HOUSEHOLDS
0.0/ 100
METRIC RATING
316th/ 347
METRIC RANK

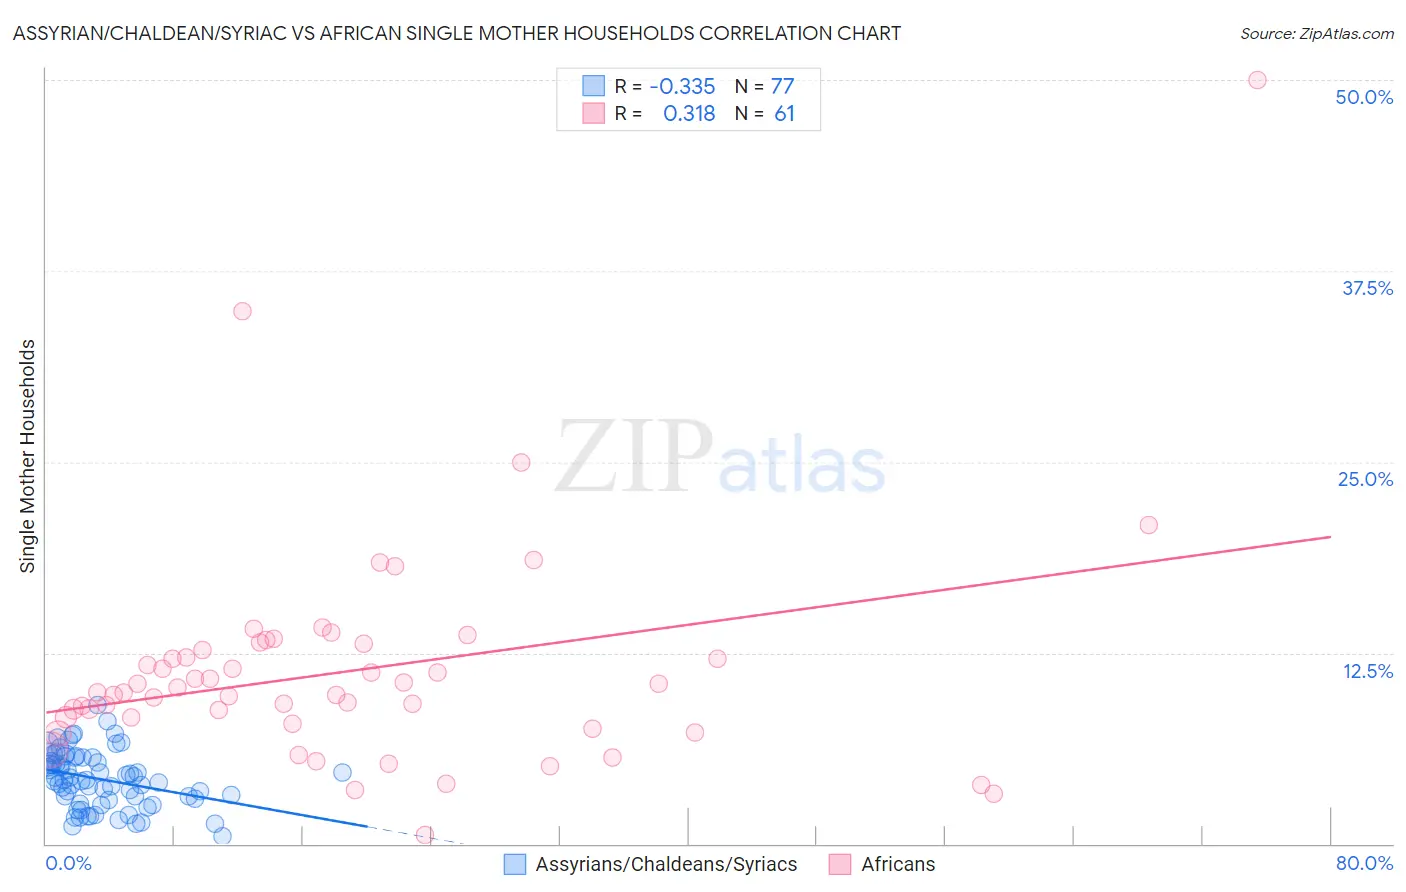
Assyrian/Chaldean/Syriac vs African Single Mother Households Correlation Chart

The statistical analysis conducted on geographies consisting of 110,241,669 people shows a mild negative correlation between the proportion of Assyrians/Chaldeans/Syriacs and percentage of single mother households in the United States with a correlation coefficient (R) of -0.335 and weighted average of 4.8%. Similarly, the statistical analysis conducted on geographies consisting of 468,558,446 people shows a mild positive correlation between the proportion of Africans and percentage of single mother households in the United States with a correlation coefficient (R) of 0.318 and weighted average of 8.2%, a difference of 70.0%.
Assyrian/Chaldean/Syriac vs African Single Mother Households

Single Mother Households Correlation Summary

MeasurementAssyrian/Chaldean/SyriacAfrican
Minimum0.50%0.60%
Maximum9.0%50.0%
Range8.5%49.4%
Mean4.2%11.3%
Median4.2%9.9%
Interquartile 25% (IQ1)2.9%8.1%
Interquartile 75% (IQ3)5.6%12.9%
Interquartile Range (IQR)2.7%4.8%
Standard Deviation (Sample)1.8%7.3%
Standard Deviation (Population)1.8%7.3%

Similar Demographics by Single Mother Households

Demographics Similar to Assyrians/Chaldeans/Syriacs by Single Mother Households

In terms of single mother households, the demographic groups most similar to Assyrians/Chaldeans/Syriacs are Immigrants from Iran (4.8%, a difference of 0.080%), Immigrants from Hong Kong (4.8%, a difference of 0.52%), Filipino (4.7%, a difference of 2.4%), Immigrants from Taiwan (4.7%, a difference of 2.7%), and Immigrants from Singapore (5.0%, a difference of 3.1%).
DemographicsRating | RankSingle Mother Households
Immigrants | Taiwan
100.0
/100
|
#1
Exceptional
4.7%
Filipinos
100.0
/100
|
#2
Exceptional
4.7%
Immigrants | Iran
100.0
/100
|
#3
Exceptional
4.8%
Assyrians/Chaldeans/Syriacs
100.0
/100
|
#4
Exceptional
4.8%
Immigrants | Hong Kong
100.0
/100
|
#5
Exceptional
4.8%
Immigrants | Singapore
100.0
/100
|
#6
Exceptional
5.0%
Iranians
100.0
/100
|
#7
Exceptional
5.0%
Immigrants | Ireland
99.9
/100
|
#8
Exceptional
5.0%
Okinawans
99.9
/100
|
#9
Exceptional
5.0%
Immigrants | Israel
99.9
/100
|
#10
Exceptional
5.0%
Immigrants | China
99.9
/100
|
#11
Exceptional
5.1%
Cypriots
99.9
/100
|
#12
Exceptional
5.1%
Immigrants | India
99.9
/100
|
#13
Exceptional
5.1%
Immigrants | Australia
99.9
/100
|
#14
Exceptional
5.1%
Immigrants | Eastern Asia
99.9
/100
|
#15
Exceptional
5.1%

Demographics Similar to Africans by Single Mother Households

In terms of single mother households, the demographic groups most similar to Africans are Immigrants from Honduras (8.2%, a difference of 0.14%), Immigrants from Western Africa (8.2%, a difference of 0.15%), Immigrants from Mexico (8.2%, a difference of 0.17%), Immigrants from Grenada (8.2%, a difference of 0.29%), and Bangladeshi (8.1%, a difference of 0.46%).
DemographicsRating | RankSingle Mother Households
Cheyenne
0.0
/100
|
#309
Tragic
8.1%
Hondurans
0.0
/100
|
#310
Tragic
8.1%
Immigrants | Congo
0.0
/100
|
#311
Tragic
8.1%
Bangladeshis
0.0
/100
|
#312
Tragic
8.1%
Immigrants | Grenada
0.0
/100
|
#313
Tragic
8.2%
Immigrants | Mexico
0.0
/100
|
#314
Tragic
8.2%
Immigrants | Western Africa
0.0
/100
|
#315
Tragic
8.2%
Africans
0.0
/100
|
#316
Tragic
8.2%
Immigrants | Honduras
0.0
/100
|
#317
Tragic
8.2%
Senegalese
0.0
/100
|
#318
Tragic
8.2%
Jamaicans
0.0
/100
|
#319
Tragic
8.2%
Bahamians
0.0
/100
|
#320
Tragic
8.3%
Immigrants | Senegal
0.0
/100
|
#321
Tragic
8.3%
Pima
0.0
/100
|
#322
Tragic
8.3%
Haitians
0.0
/100
|
#323
Tragic
8.3%