Assyrian/Chaldean/Syriac vs Puget Sound Salish Single Mother Households
COMPARE
Assyrian/Chaldean/Syriac
Puget Sound Salish
Single Mother Households
Single Mother Households Comparison
Assyrians/Chaldeans/Syriacs
Puget Sound Salish
4.8%
SINGLE MOTHER HOUSEHOLDS
100.0/ 100
METRIC RATING
4th/ 347
METRIC RANK
6.3%
SINGLE MOTHER HOUSEHOLDS
58.1/ 100
METRIC RATING
169th/ 347
METRIC RANK
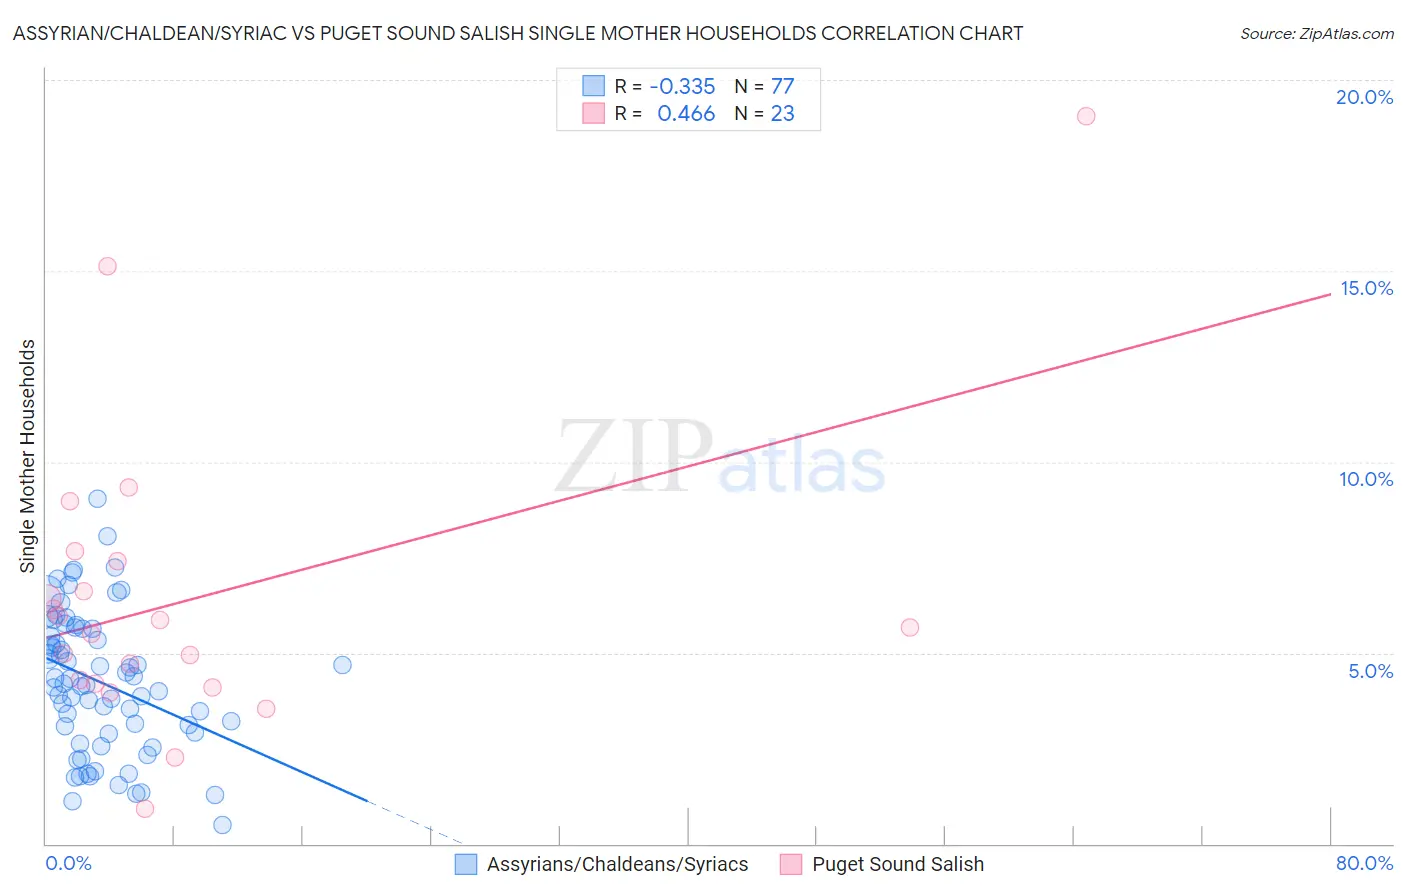
Assyrian/Chaldean/Syriac vs Puget Sound Salish Single Mother Households Correlation Chart
The statistical analysis conducted on geographies consisting of 110,241,669 people shows a mild negative correlation between the proportion of Assyrians/Chaldeans/Syriacs and percentage of single mother households in the United States with a correlation coefficient (R) of -0.335 and weighted average of 4.8%. Similarly, the statistical analysis conducted on geographies consisting of 46,127,727 people shows a moderate positive correlation between the proportion of Puget Sound Salish and percentage of single mother households in the United States with a correlation coefficient (R) of 0.466 and weighted average of 6.3%, a difference of 30.0%.
Single Mother Households Correlation Summary
| Measurement | Assyrian/Chaldean/Syriac | Puget Sound Salish |
| Minimum | 0.50% | 0.93% |
| Maximum | 9.0% | 19.0% |
| Range | 8.5% | 18.1% |
| Mean | 4.2% | 6.4% |
| Median | 4.2% | 5.7% |
| Interquartile 25% (IQ1) | 2.9% | 4.2% |
| Interquartile 75% (IQ3) | 5.6% | 7.4% |
| Interquartile Range (IQR) | 2.7% | 3.2% |
| Standard Deviation (Sample) | 1.8% | 3.9% |
| Standard Deviation (Population) | 1.8% | 3.8% |
Similar Demographics by Single Mother Households
Demographics Similar to Assyrians/Chaldeans/Syriacs by Single Mother Households
In terms of single mother households, the demographic groups most similar to Assyrians/Chaldeans/Syriacs are Immigrants from Iran (4.8%, a difference of 0.080%), Immigrants from Hong Kong (4.8%, a difference of 0.52%), Filipino (4.7%, a difference of 2.4%), Immigrants from Taiwan (4.7%, a difference of 2.7%), and Immigrants from Singapore (5.0%, a difference of 3.1%).
| Demographics | Rating | Rank | Single Mother Households |
| Immigrants | Taiwan | 100.0 /100 | #1 | Exceptional 4.7% |
| Filipinos | 100.0 /100 | #2 | Exceptional 4.7% |
| Immigrants | Iran | 100.0 /100 | #3 | Exceptional 4.8% |
| Assyrians/Chaldeans/Syriacs | 100.0 /100 | #4 | Exceptional 4.8% |
| Immigrants | Hong Kong | 100.0 /100 | #5 | Exceptional 4.8% |
| Immigrants | Singapore | 100.0 /100 | #6 | Exceptional 5.0% |
| Iranians | 100.0 /100 | #7 | Exceptional 5.0% |
| Immigrants | Ireland | 99.9 /100 | #8 | Exceptional 5.0% |
| Okinawans | 99.9 /100 | #9 | Exceptional 5.0% |
| Immigrants | Israel | 99.9 /100 | #10 | Exceptional 5.0% |
| Immigrants | China | 99.9 /100 | #11 | Exceptional 5.1% |
| Cypriots | 99.9 /100 | #12 | Exceptional 5.1% |
| Immigrants | India | 99.9 /100 | #13 | Exceptional 5.1% |
| Immigrants | Australia | 99.9 /100 | #14 | Exceptional 5.1% |
| Immigrants | Eastern Asia | 99.9 /100 | #15 | Exceptional 5.1% |
Demographics Similar to Puget Sound Salish by Single Mother Households
In terms of single mother households, the demographic groups most similar to Puget Sound Salish are Immigrants from Chile (6.3%, a difference of 0.020%), Brazilian (6.2%, a difference of 0.11%), Immigrants from Oceania (6.3%, a difference of 0.40%), Afghan (6.3%, a difference of 0.63%), and Immigrants from South Eastern Asia (6.3%, a difference of 0.66%).
| Demographics | Rating | Rank | Single Mother Households |
| Immigrants | Zimbabwe | 69.9 /100 | #162 | Good 6.2% |
| Alsatians | 68.7 /100 | #163 | Good 6.2% |
| Immigrants | Northern Africa | 68.0 /100 | #164 | Good 6.2% |
| Immigrants | Syria | 67.4 /100 | #165 | Good 6.2% |
| Sri Lankans | 63.9 /100 | #166 | Good 6.2% |
| Brazilians | 59.1 /100 | #167 | Average 6.2% |
| Immigrants | Chile | 58.3 /100 | #168 | Average 6.3% |
| Puget Sound Salish | 58.1 /100 | #169 | Average 6.3% |
| Immigrants | Oceania | 54.6 /100 | #170 | Average 6.3% |
| Afghans | 52.5 /100 | #171 | Average 6.3% |
| Immigrants | South Eastern Asia | 52.2 /100 | #172 | Average 6.3% |
| Immigrants | Vietnam | 51.5 /100 | #173 | Average 6.3% |
| Immigrants | Morocco | 50.0 /100 | #174 | Average 6.3% |
| Marshallese | 45.8 /100 | #175 | Average 6.3% |
| Immigrants | Bosnia and Herzegovina | 44.3 /100 | #176 | Average 6.3% |