Assyrian/Chaldean/Syriac vs Immigrants from Belize Single Mother Households
COMPARE
Assyrian/Chaldean/Syriac
Immigrants from Belize
Single Mother Households
Single Mother Households Comparison
Assyrians/Chaldeans/Syriacs
Immigrants from Belize
4.8%
SINGLE MOTHER HOUSEHOLDS
100.0/ 100
METRIC RATING
4th/ 347
METRIC RANK
7.7%
SINGLE MOTHER HOUSEHOLDS
0.0/ 100
METRIC RATING
284th/ 347
METRIC RANK
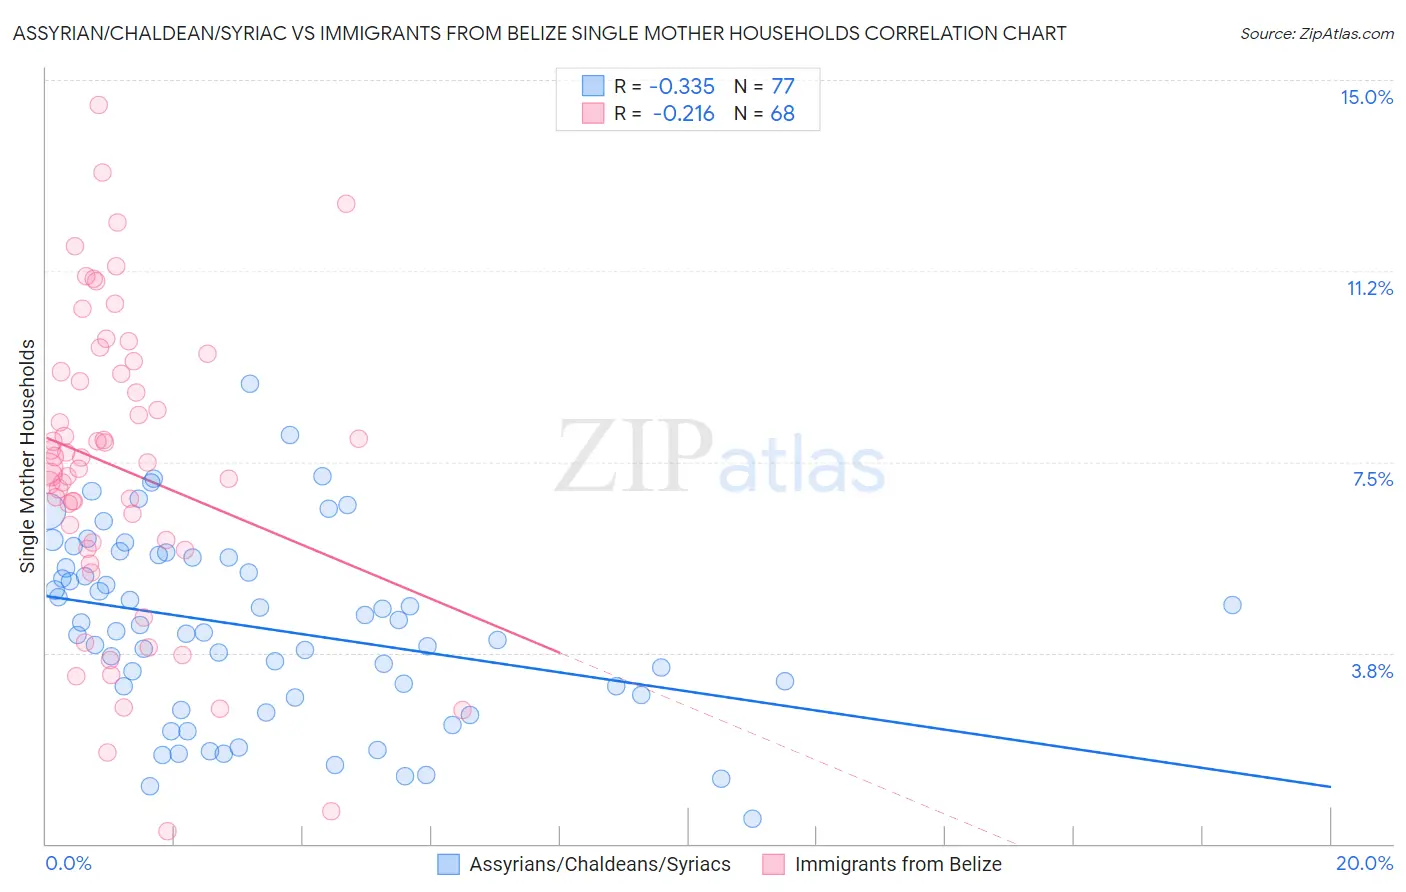
Assyrian/Chaldean/Syriac vs Immigrants from Belize Single Mother Households Correlation Chart
The statistical analysis conducted on geographies consisting of 110,241,669 people shows a mild negative correlation between the proportion of Assyrians/Chaldeans/Syriacs and percentage of single mother households in the United States with a correlation coefficient (R) of -0.335 and weighted average of 4.8%. Similarly, the statistical analysis conducted on geographies consisting of 130,177,465 people shows a weak negative correlation between the proportion of Immigrants from Belize and percentage of single mother households in the United States with a correlation coefficient (R) of -0.216 and weighted average of 7.7%, a difference of 60.3%.
Single Mother Households Correlation Summary
| Measurement | Assyrian/Chaldean/Syriac | Immigrants from Belize |
| Minimum | 0.50% | 0.26% |
| Maximum | 9.0% | 14.5% |
| Range | 8.5% | 14.2% |
| Mean | 4.2% | 7.4% |
| Median | 4.2% | 7.4% |
| Interquartile 25% (IQ1) | 2.9% | 5.8% |
| Interquartile 75% (IQ3) | 5.6% | 9.3% |
| Interquartile Range (IQR) | 2.7% | 3.4% |
| Standard Deviation (Sample) | 1.8% | 3.0% |
| Standard Deviation (Population) | 1.8% | 2.9% |
Similar Demographics by Single Mother Households
Demographics Similar to Assyrians/Chaldeans/Syriacs by Single Mother Households
In terms of single mother households, the demographic groups most similar to Assyrians/Chaldeans/Syriacs are Immigrants from Iran (4.8%, a difference of 0.080%), Immigrants from Hong Kong (4.8%, a difference of 0.52%), Filipino (4.7%, a difference of 2.4%), Immigrants from Taiwan (4.7%, a difference of 2.7%), and Immigrants from Singapore (5.0%, a difference of 3.1%).
| Demographics | Rating | Rank | Single Mother Households |
| Immigrants | Taiwan | 100.0 /100 | #1 | Exceptional 4.7% |
| Filipinos | 100.0 /100 | #2 | Exceptional 4.7% |
| Immigrants | Iran | 100.0 /100 | #3 | Exceptional 4.8% |
| Assyrians/Chaldeans/Syriacs | 100.0 /100 | #4 | Exceptional 4.8% |
| Immigrants | Hong Kong | 100.0 /100 | #5 | Exceptional 4.8% |
| Immigrants | Singapore | 100.0 /100 | #6 | Exceptional 5.0% |
| Iranians | 100.0 /100 | #7 | Exceptional 5.0% |
| Immigrants | Ireland | 99.9 /100 | #8 | Exceptional 5.0% |
| Okinawans | 99.9 /100 | #9 | Exceptional 5.0% |
| Immigrants | Israel | 99.9 /100 | #10 | Exceptional 5.0% |
| Immigrants | China | 99.9 /100 | #11 | Exceptional 5.1% |
| Cypriots | 99.9 /100 | #12 | Exceptional 5.1% |
| Immigrants | India | 99.9 /100 | #13 | Exceptional 5.1% |
| Immigrants | Australia | 99.9 /100 | #14 | Exceptional 5.1% |
| Immigrants | Eastern Asia | 99.9 /100 | #15 | Exceptional 5.1% |
Demographics Similar to Immigrants from Belize by Single Mother Households
In terms of single mother households, the demographic groups most similar to Immigrants from Belize are Trinidadian and Tobagonian (7.7%, a difference of 0.030%), Immigrants from Middle Africa (7.7%, a difference of 0.14%), Immigrants from Guatemala (7.7%, a difference of 0.24%), Sierra Leonean (7.7%, a difference of 0.29%), and Nigerian (7.7%, a difference of 0.60%).
| Demographics | Rating | Rank | Single Mother Households |
| Immigrants | Trinidad and Tobago | 0.1 /100 | #277 | Tragic 7.6% |
| Central Americans | 0.1 /100 | #278 | Tragic 7.6% |
| Immigrants | El Salvador | 0.0 /100 | #279 | Tragic 7.6% |
| Immigrants | Sierra Leone | 0.0 /100 | #280 | Tragic 7.7% |
| Immigrants | Laos | 0.0 /100 | #281 | Tragic 7.7% |
| Guatemalans | 0.0 /100 | #282 | Tragic 7.7% |
| Nigerians | 0.0 /100 | #283 | Tragic 7.7% |
| Immigrants | Belize | 0.0 /100 | #284 | Tragic 7.7% |
| Trinidadians and Tobagonians | 0.0 /100 | #285 | Tragic 7.7% |
| Immigrants | Middle Africa | 0.0 /100 | #286 | Tragic 7.7% |
| Immigrants | Guatemala | 0.0 /100 | #287 | Tragic 7.7% |
| Sierra Leoneans | 0.0 /100 | #288 | Tragic 7.7% |
| Sub-Saharan Africans | 0.0 /100 | #289 | Tragic 7.8% |
| Immigrants | Nigeria | 0.0 /100 | #290 | Tragic 7.8% |
| West Indians | 0.0 /100 | #291 | Tragic 7.8% |