Immigrants from South Africa vs Mongolian Single Mother Households
COMPARE
Immigrants from South Africa
Mongolian
Single Mother Households
Single Mother Households Comparison
Immigrants from South Africa
Mongolians
5.7%
SINGLE MOTHER HOUSEHOLDS
96.3/ 100
METRIC RATING
98th/ 347
METRIC RANK
5.8%
SINGLE MOTHER HOUSEHOLDS
95.3/ 100
METRIC RATING
113th/ 347
METRIC RANK
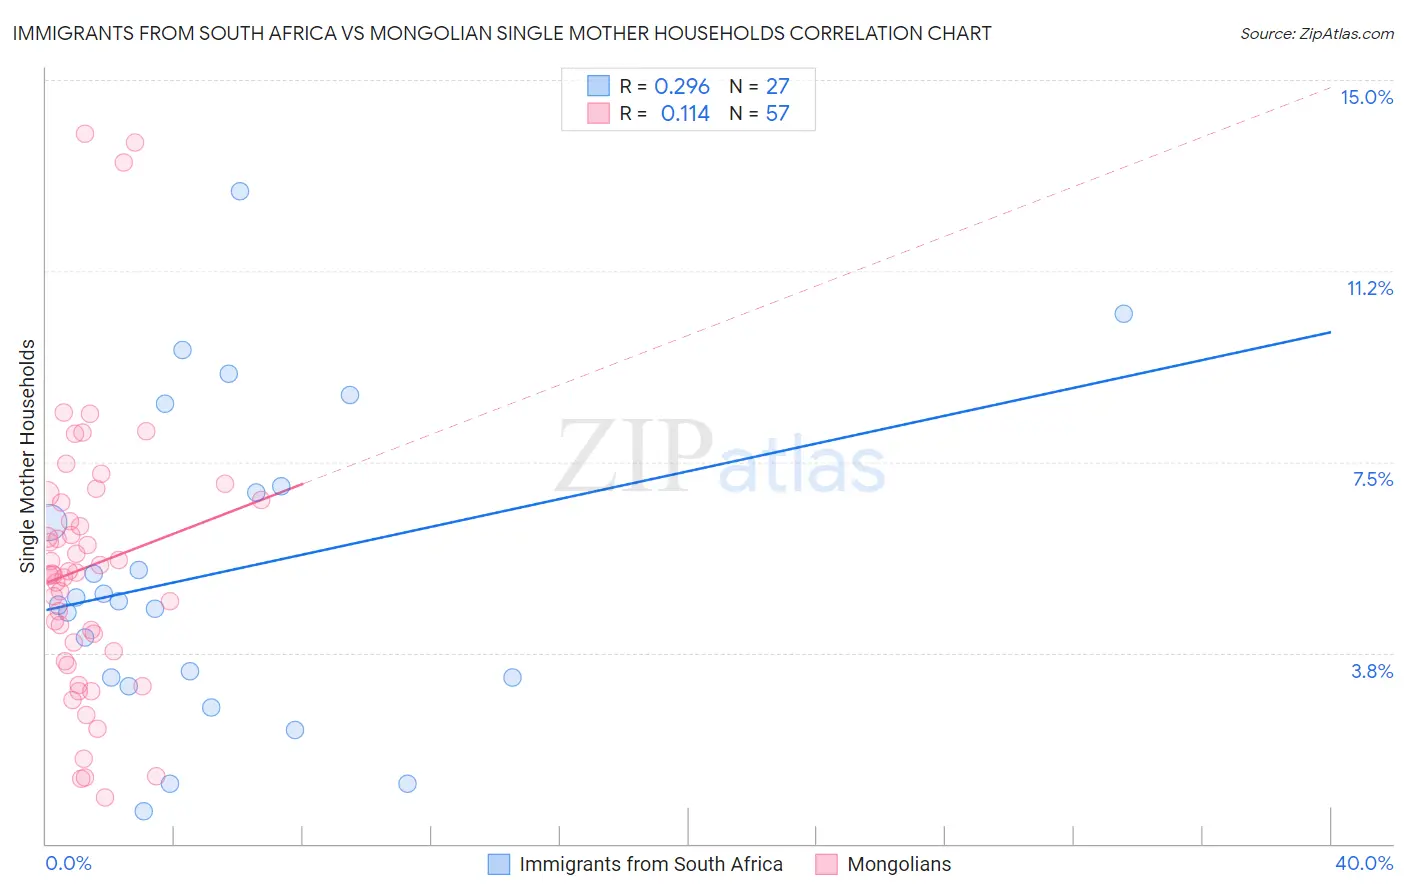
Immigrants from South Africa vs Mongolian Single Mother Households Correlation Chart
The statistical analysis conducted on geographies consisting of 232,880,827 people shows a weak positive correlation between the proportion of Immigrants from South Africa and percentage of single mother households in the United States with a correlation coefficient (R) of 0.296 and weighted average of 5.7%. Similarly, the statistical analysis conducted on geographies consisting of 140,225,354 people shows a poor positive correlation between the proportion of Mongolians and percentage of single mother households in the United States with a correlation coefficient (R) of 0.114 and weighted average of 5.8%, a difference of 0.74%.
Single Mother Households Correlation Summary
| Measurement | Immigrants from South Africa | Mongolian |
| Minimum | 0.63% | 0.92% |
| Maximum | 12.8% | 14.0% |
| Range | 12.2% | 13.0% |
| Mean | 5.3% | 5.4% |
| Median | 4.8% | 5.3% |
| Interquartile 25% (IQ1) | 3.3% | 3.7% |
| Interquartile 75% (IQ3) | 7.0% | 6.7% |
| Interquartile Range (IQR) | 3.8% | 3.0% |
| Standard Deviation (Sample) | 3.0% | 2.7% |
| Standard Deviation (Population) | 3.0% | 2.7% |
Demographics Similar to Immigrants from South Africa and Mongolians by Single Mother Households
In terms of single mother households, the demographic groups most similar to Immigrants from South Africa are Tlingit-Haida (5.7%, a difference of 0.040%), Immigrants from Poland (5.8%, a difference of 0.050%), Scandinavian (5.8%, a difference of 0.070%), Austrian (5.7%, a difference of 0.090%), and German (5.8%, a difference of 0.10%). Similarly, the demographic groups most similar to Mongolians are Immigrants from Kuwait (5.8%, a difference of 0.070%), Immigrants from England (5.8%, a difference of 0.11%), Dutch (5.8%, a difference of 0.13%), British (5.8%, a difference of 0.14%), and Immigrants from Western Europe (5.8%, a difference of 0.23%).
| Demographics | Rating | Rank | Single Mother Households |
| Slovaks | 96.6 /100 | #95 | Exceptional 5.7% |
| Austrians | 96.4 /100 | #96 | Exceptional 5.7% |
| Tlingit-Haida | 96.4 /100 | #97 | Exceptional 5.7% |
| Immigrants | South Africa | 96.3 /100 | #98 | Exceptional 5.7% |
| Immigrants | Poland | 96.3 /100 | #99 | Exceptional 5.8% |
| Scandinavians | 96.2 /100 | #100 | Exceptional 5.8% |
| Germans | 96.2 /100 | #101 | Exceptional 5.8% |
| English | 96.2 /100 | #102 | Exceptional 5.8% |
| Scottish | 96.2 /100 | #103 | Exceptional 5.8% |
| Northern Europeans | 96.2 /100 | #104 | Exceptional 5.8% |
| Taiwanese | 96.1 /100 | #105 | Exceptional 5.8% |
| Immigrants | Ukraine | 95.9 /100 | #106 | Exceptional 5.8% |
| Paraguayans | 95.8 /100 | #107 | Exceptional 5.8% |
| Immigrants | Italy | 95.8 /100 | #108 | Exceptional 5.8% |
| Immigrants | Western Europe | 95.7 /100 | #109 | Exceptional 5.8% |
| British | 95.5 /100 | #110 | Exceptional 5.8% |
| Immigrants | England | 95.5 /100 | #111 | Exceptional 5.8% |
| Immigrants | Kuwait | 95.4 /100 | #112 | Exceptional 5.8% |
| Mongolians | 95.3 /100 | #113 | Exceptional 5.8% |
| Dutch | 95.1 /100 | #114 | Exceptional 5.8% |
| Irish | 94.8 /100 | #115 | Exceptional 5.8% |