Assyrian/Chaldean/Syriac vs Immigrants from Belize 2nd Grade
COMPARE
Assyrian/Chaldean/Syriac
Immigrants from Belize
2nd Grade
2nd Grade Comparison
Assyrians/Chaldeans/Syriacs
Immigrants from Belize
97.5%
2ND GRADE
0.5/ 100
METRIC RATING
260th/ 347
METRIC RANK
96.8%
2ND GRADE
0.0/ 100
METRIC RATING
315th/ 347
METRIC RANK
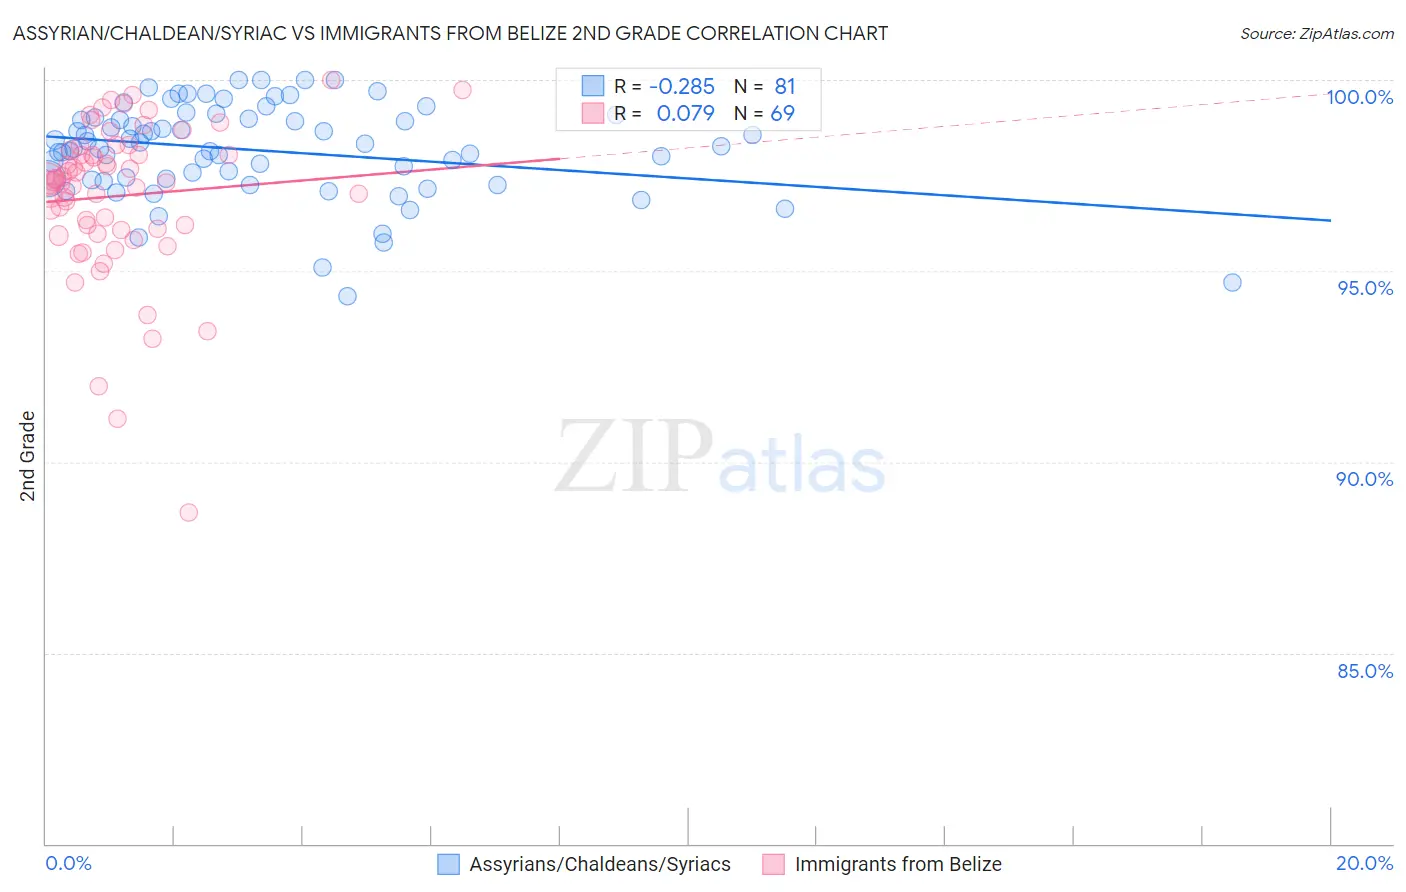
Assyrian/Chaldean/Syriac vs Immigrants from Belize 2nd Grade Correlation Chart
The statistical analysis conducted on geographies consisting of 110,318,304 people shows a weak negative correlation between the proportion of Assyrians/Chaldeans/Syriacs and percentage of population with at least 2nd grade education in the United States with a correlation coefficient (R) of -0.285 and weighted average of 97.5%. Similarly, the statistical analysis conducted on geographies consisting of 130,328,311 people shows a slight positive correlation between the proportion of Immigrants from Belize and percentage of population with at least 2nd grade education in the United States with a correlation coefficient (R) of 0.079 and weighted average of 96.8%, a difference of 0.72%.
2nd Grade Correlation Summary
| Measurement | Assyrian/Chaldean/Syriac | Immigrants from Belize |
| Minimum | 94.3% | 88.7% |
| Maximum | 100.0% | 100.0% |
| Range | 5.7% | 11.3% |
| Mean | 98.2% | 97.0% |
| Median | 98.3% | 97.4% |
| Interquartile 25% (IQ1) | 97.4% | 96.1% |
| Interquartile 75% (IQ3) | 99.0% | 98.1% |
| Interquartile Range (IQR) | 1.6% | 2.0% |
| Standard Deviation (Sample) | 1.2% | 2.0% |
| Standard Deviation (Population) | 1.2% | 2.0% |
Similar Demographics by 2nd Grade
Demographics Similar to Assyrians/Chaldeans/Syriacs by 2nd Grade
In terms of 2nd grade, the demographic groups most similar to Assyrians/Chaldeans/Syriacs are Fijian (97.5%, a difference of 0.0%), Armenian (97.5%, a difference of 0.0%), Immigrants from Colombia (97.5%, a difference of 0.010%), Yaqui (97.5%, a difference of 0.010%), and Taiwanese (97.4%, a difference of 0.010%).
| Demographics | Rating | Rank | 2nd Grade |
| Puerto Ricans | 0.7 /100 | #253 | Tragic 97.5% |
| Indians (Asian) | 0.6 /100 | #254 | Tragic 97.5% |
| Immigrants | Congo | 0.6 /100 | #255 | Tragic 97.5% |
| Jamaicans | 0.6 /100 | #256 | Tragic 97.5% |
| Immigrants | Colombia | 0.5 /100 | #257 | Tragic 97.5% |
| Yaqui | 0.5 /100 | #258 | Tragic 97.5% |
| Fijians | 0.5 /100 | #259 | Tragic 97.5% |
| Assyrians/Chaldeans/Syriacs | 0.5 /100 | #260 | Tragic 97.5% |
| Armenians | 0.5 /100 | #261 | Tragic 97.5% |
| Taiwanese | 0.4 /100 | #262 | Tragic 97.4% |
| Immigrants | Ethiopia | 0.4 /100 | #263 | Tragic 97.4% |
| Immigrants | Liberia | 0.4 /100 | #264 | Tragic 97.4% |
| Immigrants | South America | 0.4 /100 | #265 | Tragic 97.4% |
| Immigrants | Sierra Leone | 0.4 /100 | #266 | Tragic 97.4% |
| Cubans | 0.3 /100 | #267 | Tragic 97.4% |
Demographics Similar to Immigrants from Belize by 2nd Grade
In terms of 2nd grade, the demographic groups most similar to Immigrants from Belize are Honduran (96.7%, a difference of 0.010%), Immigrants from Laos (96.7%, a difference of 0.010%), Indonesian (96.7%, a difference of 0.010%), Immigrants from Nicaragua (96.7%, a difference of 0.010%), and Immigrants from Ecuador (96.8%, a difference of 0.020%).
| Demographics | Rating | Rank | 2nd Grade |
| Immigrants | Haiti | 0.0 /100 | #308 | Tragic 96.8% |
| Belizeans | 0.0 /100 | #309 | Tragic 96.8% |
| Sri Lankans | 0.0 /100 | #310 | Tragic 96.8% |
| Guyanese | 0.0 /100 | #311 | Tragic 96.8% |
| Cape Verdeans | 0.0 /100 | #312 | Tragic 96.8% |
| Hispanics or Latinos | 0.0 /100 | #313 | Tragic 96.8% |
| Immigrants | Ecuador | 0.0 /100 | #314 | Tragic 96.8% |
| Immigrants | Belize | 0.0 /100 | #315 | Tragic 96.8% |
| Hondurans | 0.0 /100 | #316 | Tragic 96.7% |
| Immigrants | Laos | 0.0 /100 | #317 | Tragic 96.7% |
| Indonesians | 0.0 /100 | #318 | Tragic 96.7% |
| Immigrants | Nicaragua | 0.0 /100 | #319 | Tragic 96.7% |
| Immigrants | Guyana | 0.0 /100 | #320 | Tragic 96.7% |
| Immigrants | Burma/Myanmar | 0.0 /100 | #321 | Tragic 96.7% |
| Immigrants | Bangladesh | 0.0 /100 | #322 | Tragic 96.7% |