Cambodian vs Immigrants from Belize Single Mother Households
COMPARE
Cambodian
Immigrants from Belize
Single Mother Households
Single Mother Households Comparison
Cambodians
Immigrants from Belize
5.3%
SINGLE MOTHER HOUSEHOLDS
99.7/ 100
METRIC RATING
32nd/ 347
METRIC RANK
7.7%
SINGLE MOTHER HOUSEHOLDS
0.0/ 100
METRIC RATING
284th/ 347
METRIC RANK
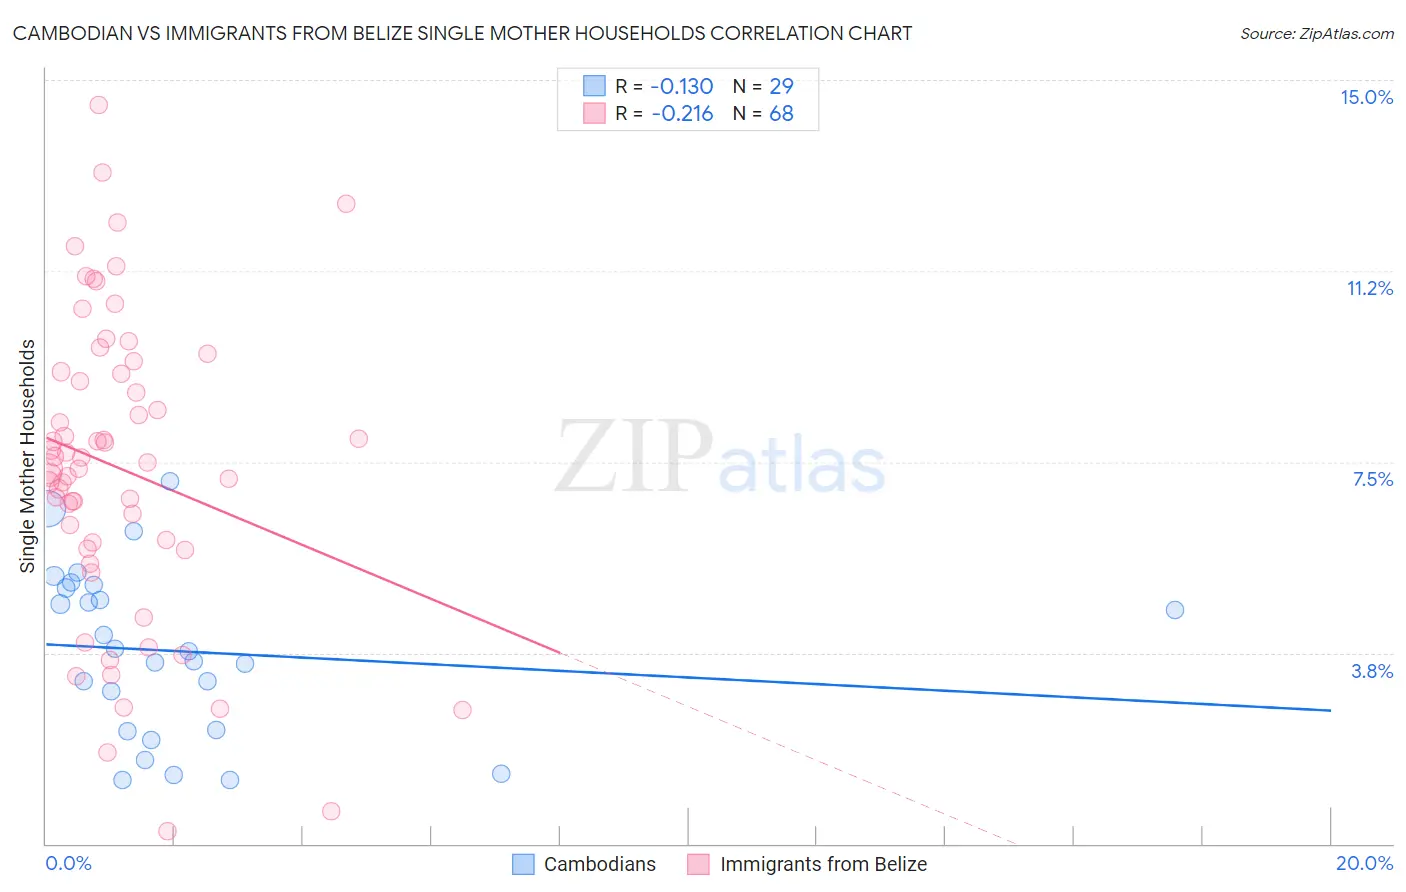
Cambodian vs Immigrants from Belize Single Mother Households Correlation Chart
The statistical analysis conducted on geographies consisting of 102,433,936 people shows a poor negative correlation between the proportion of Cambodians and percentage of single mother households in the United States with a correlation coefficient (R) of -0.130 and weighted average of 5.3%. Similarly, the statistical analysis conducted on geographies consisting of 130,177,465 people shows a weak negative correlation between the proportion of Immigrants from Belize and percentage of single mother households in the United States with a correlation coefficient (R) of -0.216 and weighted average of 7.7%, a difference of 45.8%.
Single Mother Households Correlation Summary
| Measurement | Cambodian | Immigrants from Belize |
| Minimum | 1.2% | 0.26% |
| Maximum | 7.1% | 14.5% |
| Range | 5.9% | 14.2% |
| Mean | 3.8% | 7.4% |
| Median | 3.8% | 7.4% |
| Interquartile 25% (IQ1) | 2.2% | 5.8% |
| Interquartile 75% (IQ3) | 5.1% | 9.3% |
| Interquartile Range (IQR) | 2.8% | 3.4% |
| Standard Deviation (Sample) | 1.6% | 3.0% |
| Standard Deviation (Population) | 1.6% | 2.9% |
Similar Demographics by Single Mother Households
Demographics Similar to Cambodians by Single Mother Households
In terms of single mother households, the demographic groups most similar to Cambodians are Burmese (5.3%, a difference of 0.010%), Immigrants from Korea (5.3%, a difference of 0.010%), Latvian (5.3%, a difference of 0.070%), Russian (5.3%, a difference of 0.090%), and Bhutanese (5.3%, a difference of 0.19%).
| Demographics | Rating | Rank | Single Mother Households |
| Immigrants | Japan | 99.8 /100 | #25 | Exceptional 5.2% |
| Immigrants | Lithuania | 99.8 /100 | #26 | Exceptional 5.3% |
| Bhutanese | 99.7 /100 | #27 | Exceptional 5.3% |
| Russians | 99.7 /100 | #28 | Exceptional 5.3% |
| Latvians | 99.7 /100 | #29 | Exceptional 5.3% |
| Burmese | 99.7 /100 | #30 | Exceptional 5.3% |
| Immigrants | Korea | 99.7 /100 | #31 | Exceptional 5.3% |
| Cambodians | 99.7 /100 | #32 | Exceptional 5.3% |
| Immigrants | Switzerland | 99.7 /100 | #33 | Exceptional 5.3% |
| Bulgarians | 99.7 /100 | #34 | Exceptional 5.3% |
| Immigrants | Northern Europe | 99.7 /100 | #35 | Exceptional 5.3% |
| Immigrants | Czechoslovakia | 99.7 /100 | #36 | Exceptional 5.3% |
| Immigrants | Belgium | 99.7 /100 | #37 | Exceptional 5.3% |
| Immigrants | Serbia | 99.6 /100 | #38 | Exceptional 5.4% |
| Immigrants | Sweden | 99.6 /100 | #39 | Exceptional 5.4% |
Demographics Similar to Immigrants from Belize by Single Mother Households
In terms of single mother households, the demographic groups most similar to Immigrants from Belize are Trinidadian and Tobagonian (7.7%, a difference of 0.030%), Immigrants from Middle Africa (7.7%, a difference of 0.14%), Immigrants from Guatemala (7.7%, a difference of 0.24%), Sierra Leonean (7.7%, a difference of 0.29%), and Nigerian (7.7%, a difference of 0.60%).
| Demographics | Rating | Rank | Single Mother Households |
| Immigrants | Trinidad and Tobago | 0.1 /100 | #277 | Tragic 7.6% |
| Central Americans | 0.1 /100 | #278 | Tragic 7.6% |
| Immigrants | El Salvador | 0.0 /100 | #279 | Tragic 7.6% |
| Immigrants | Sierra Leone | 0.0 /100 | #280 | Tragic 7.7% |
| Immigrants | Laos | 0.0 /100 | #281 | Tragic 7.7% |
| Guatemalans | 0.0 /100 | #282 | Tragic 7.7% |
| Nigerians | 0.0 /100 | #283 | Tragic 7.7% |
| Immigrants | Belize | 0.0 /100 | #284 | Tragic 7.7% |
| Trinidadians and Tobagonians | 0.0 /100 | #285 | Tragic 7.7% |
| Immigrants | Middle Africa | 0.0 /100 | #286 | Tragic 7.7% |
| Immigrants | Guatemala | 0.0 /100 | #287 | Tragic 7.7% |
| Sierra Leoneans | 0.0 /100 | #288 | Tragic 7.7% |
| Sub-Saharan Africans | 0.0 /100 | #289 | Tragic 7.8% |
| Immigrants | Nigeria | 0.0 /100 | #290 | Tragic 7.8% |
| West Indians | 0.0 /100 | #291 | Tragic 7.8% |