Assyrian/Chaldean/Syriac vs Immigrants from Belize Hearing Disability
COMPARE
Assyrian/Chaldean/Syriac
Immigrants from Belize
Hearing Disability
Hearing Disability Comparison
Assyrians/Chaldeans/Syriacs
Immigrants from Belize
3.3%
HEARING DISABILITY
0.9/ 100
METRIC RATING
244th/ 347
METRIC RANK
2.7%
HEARING DISABILITY
98.2/ 100
METRIC RATING
66th/ 347
METRIC RANK
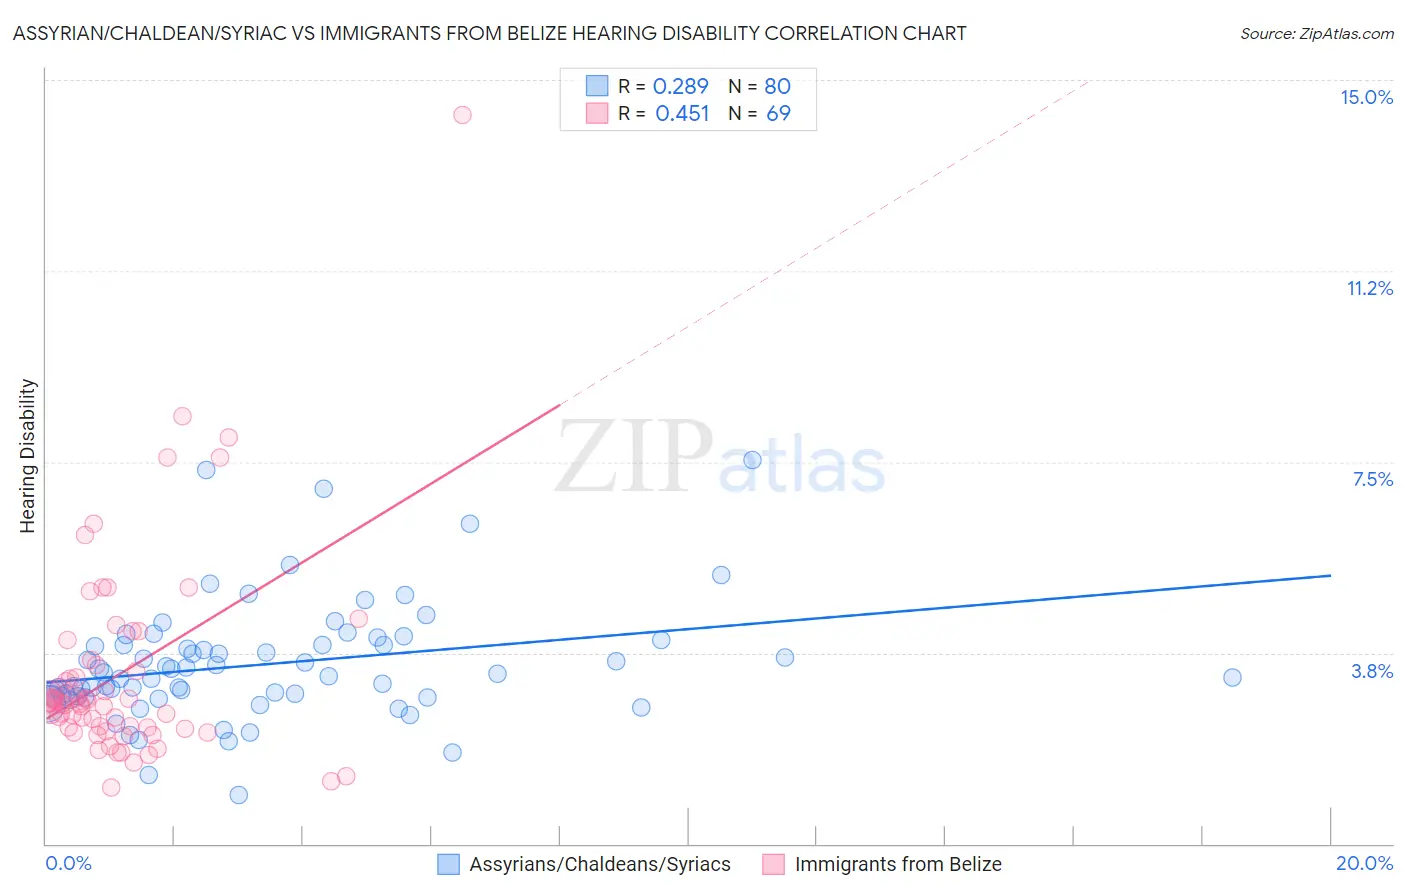
Assyrian/Chaldean/Syriac vs Immigrants from Belize Hearing Disability Correlation Chart
The statistical analysis conducted on geographies consisting of 110,312,508 people shows a weak positive correlation between the proportion of Assyrians/Chaldeans/Syriacs and percentage of population with hearing disability in the United States with a correlation coefficient (R) of 0.289 and weighted average of 3.3%. Similarly, the statistical analysis conducted on geographies consisting of 130,272,611 people shows a moderate positive correlation between the proportion of Immigrants from Belize and percentage of population with hearing disability in the United States with a correlation coefficient (R) of 0.451 and weighted average of 2.7%, a difference of 22.5%.
Hearing Disability Correlation Summary
| Measurement | Assyrian/Chaldean/Syriac | Immigrants from Belize |
| Minimum | 0.96% | 1.1% |
| Maximum | 7.5% | 14.3% |
| Range | 6.6% | 13.2% |
| Mean | 3.5% | 3.4% |
| Median | 3.3% | 2.8% |
| Interquartile 25% (IQ1) | 2.9% | 2.3% |
| Interquartile 75% (IQ3) | 3.9% | 3.6% |
| Interquartile Range (IQR) | 1.0% | 1.3% |
| Standard Deviation (Sample) | 1.2% | 2.1% |
| Standard Deviation (Population) | 1.2% | 2.0% |
Similar Demographics by Hearing Disability
Demographics Similar to Assyrians/Chaldeans/Syriacs by Hearing Disability
In terms of hearing disability, the demographic groups most similar to Assyrians/Chaldeans/Syriacs are Immigrants from Western Europe (3.3%, a difference of 0.070%), Yugoslavian (3.3%, a difference of 0.24%), Immigrants from Scotland (3.3%, a difference of 0.34%), Samoan (3.3%, a difference of 0.35%), and Immigrants from Netherlands (3.3%, a difference of 0.43%).
| Demographics | Rating | Rank | Hearing Disability |
| Immigrants | Austria | 1.8 /100 | #237 | Tragic 3.3% |
| German Russians | 1.8 /100 | #238 | Tragic 3.3% |
| Nepalese | 1.2 /100 | #239 | Tragic 3.3% |
| Immigrants | Netherlands | 1.1 /100 | #240 | Tragic 3.3% |
| Samoans | 1.1 /100 | #241 | Tragic 3.3% |
| Yugoslavians | 1.0 /100 | #242 | Tragic 3.3% |
| Immigrants | Western Europe | 1.0 /100 | #243 | Tragic 3.3% |
| Assyrians/Chaldeans/Syriacs | 0.9 /100 | #244 | Tragic 3.3% |
| Immigrants | Scotland | 0.8 /100 | #245 | Tragic 3.3% |
| Immigrants | England | 0.7 /100 | #246 | Tragic 3.3% |
| Lithuanians | 0.6 /100 | #247 | Tragic 3.4% |
| Austrians | 0.6 /100 | #248 | Tragic 3.4% |
| Italians | 0.4 /100 | #249 | Tragic 3.4% |
| Yuman | 0.4 /100 | #250 | Tragic 3.4% |
| Hungarians | 0.4 /100 | #251 | Tragic 3.4% |
Demographics Similar to Immigrants from Belize by Hearing Disability
In terms of hearing disability, the demographic groups most similar to Immigrants from Belize are Immigrants from Nepal (2.7%, a difference of 0.12%), Immigrants from Sri Lanka (2.7%, a difference of 0.21%), Egyptian (2.7%, a difference of 0.23%), Indian (Asian) (2.7%, a difference of 0.26%), and Immigrants from Uzbekistan (2.7%, a difference of 0.32%).
| Demographics | Rating | Rank | Hearing Disability |
| Immigrants | Eritrea | 98.5 /100 | #59 | Exceptional 2.7% |
| Immigrants | Egypt | 98.5 /100 | #60 | Exceptional 2.7% |
| Immigrants | Uzbekistan | 98.4 /100 | #61 | Exceptional 2.7% |
| Immigrants | Colombia | 98.4 /100 | #62 | Exceptional 2.7% |
| Indians (Asian) | 98.4 /100 | #63 | Exceptional 2.7% |
| Immigrants | Sri Lanka | 98.4 /100 | #64 | Exceptional 2.7% |
| Immigrants | Nepal | 98.3 /100 | #65 | Exceptional 2.7% |
| Immigrants | Belize | 98.2 /100 | #66 | Exceptional 2.7% |
| Egyptians | 98.1 /100 | #67 | Exceptional 2.7% |
| Immigrants | Africa | 98.0 /100 | #68 | Exceptional 2.7% |
| Nicaraguans | 97.9 /100 | #69 | Exceptional 2.7% |
| Peruvians | 97.7 /100 | #70 | Exceptional 2.7% |
| Central Americans | 97.7 /100 | #71 | Exceptional 2.7% |
| Afghans | 97.6 /100 | #72 | Exceptional 2.7% |
| Argentineans | 97.5 /100 | #73 | Exceptional 2.7% |