Arab vs Immigrants from Belize Single Mother Households
COMPARE
Arab
Immigrants from Belize
Single Mother Households
Single Mother Households Comparison
Arabs
Immigrants from Belize
6.0%
SINGLE MOTHER HOUSEHOLDS
84.0/ 100
METRIC RATING
145th/ 347
METRIC RANK
7.7%
SINGLE MOTHER HOUSEHOLDS
0.0/ 100
METRIC RATING
284th/ 347
METRIC RANK
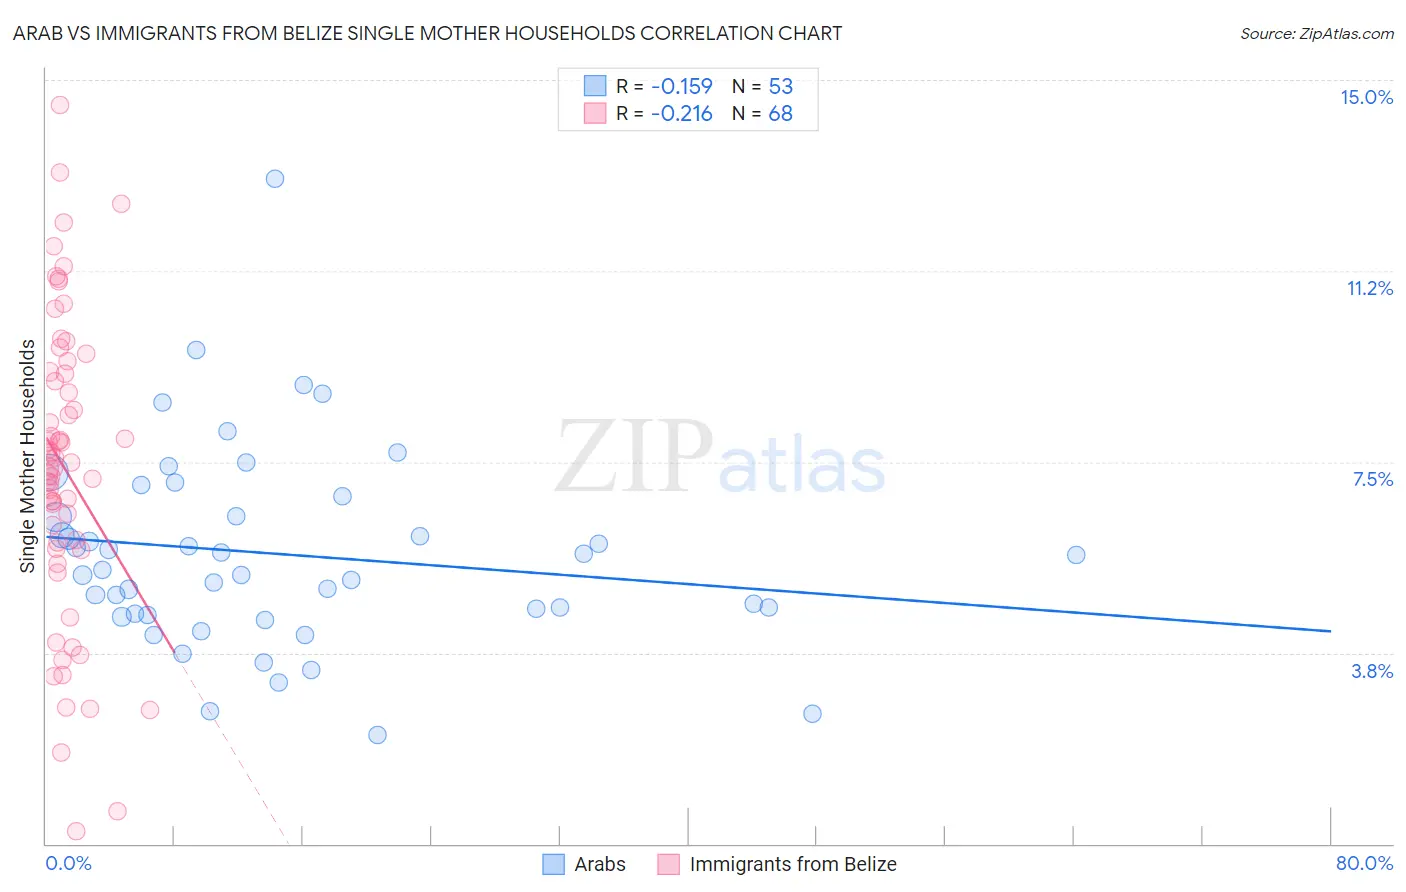
Arab vs Immigrants from Belize Single Mother Households Correlation Chart
The statistical analysis conducted on geographies consisting of 484,798,237 people shows a poor negative correlation between the proportion of Arabs and percentage of single mother households in the United States with a correlation coefficient (R) of -0.159 and weighted average of 6.0%. Similarly, the statistical analysis conducted on geographies consisting of 130,177,465 people shows a weak negative correlation between the proportion of Immigrants from Belize and percentage of single mother households in the United States with a correlation coefficient (R) of -0.216 and weighted average of 7.7%, a difference of 28.0%.
Single Mother Households Correlation Summary
| Measurement | Arab | Immigrants from Belize |
| Minimum | 2.1% | 0.26% |
| Maximum | 13.1% | 14.5% |
| Range | 10.9% | 14.2% |
| Mean | 5.7% | 7.4% |
| Median | 5.4% | 7.4% |
| Interquartile 25% (IQ1) | 4.5% | 5.8% |
| Interquartile 75% (IQ3) | 6.6% | 9.3% |
| Interquartile Range (IQR) | 2.1% | 3.4% |
| Standard Deviation (Sample) | 2.0% | 3.0% |
| Standard Deviation (Population) | 1.9% | 2.9% |
Similar Demographics by Single Mother Households
Demographics Similar to Arabs by Single Mother Households
In terms of single mother households, the demographic groups most similar to Arabs are Korean (6.0%, a difference of 0.090%), Immigrants from Iraq (6.0%, a difference of 0.19%), Immigrants from Egypt (6.0%, a difference of 0.23%), Tsimshian (6.0%, a difference of 0.28%), and French Canadian (6.0%, a difference of 0.29%).
| Demographics | Rating | Rank | Single Mother Households |
| Icelanders | 86.9 /100 | #138 | Excellent 6.0% |
| Syrians | 86.0 /100 | #139 | Excellent 6.0% |
| French | 85.7 /100 | #140 | Excellent 6.0% |
| Tsimshian | 85.2 /100 | #141 | Excellent 6.0% |
| Immigrants | Egypt | 85.0 /100 | #142 | Excellent 6.0% |
| Immigrants | Iraq | 84.8 /100 | #143 | Excellent 6.0% |
| Koreans | 84.4 /100 | #144 | Excellent 6.0% |
| Arabs | 84.0 /100 | #145 | Excellent 6.0% |
| French Canadians | 82.6 /100 | #146 | Excellent 6.0% |
| Immigrants | Jordan | 82.3 /100 | #147 | Excellent 6.0% |
| Scotch-Irish | 82.0 /100 | #148 | Excellent 6.0% |
| Immigrants | Albania | 81.5 /100 | #149 | Excellent 6.1% |
| Zimbabweans | 80.7 /100 | #150 | Excellent 6.1% |
| Immigrants | Southern Europe | 80.5 /100 | #151 | Excellent 6.1% |
| Pakistanis | 79.2 /100 | #152 | Good 6.1% |
Demographics Similar to Immigrants from Belize by Single Mother Households
In terms of single mother households, the demographic groups most similar to Immigrants from Belize are Trinidadian and Tobagonian (7.7%, a difference of 0.030%), Immigrants from Middle Africa (7.7%, a difference of 0.14%), Immigrants from Guatemala (7.7%, a difference of 0.24%), Sierra Leonean (7.7%, a difference of 0.29%), and Nigerian (7.7%, a difference of 0.60%).
| Demographics | Rating | Rank | Single Mother Households |
| Immigrants | Trinidad and Tobago | 0.1 /100 | #277 | Tragic 7.6% |
| Central Americans | 0.1 /100 | #278 | Tragic 7.6% |
| Immigrants | El Salvador | 0.0 /100 | #279 | Tragic 7.6% |
| Immigrants | Sierra Leone | 0.0 /100 | #280 | Tragic 7.7% |
| Immigrants | Laos | 0.0 /100 | #281 | Tragic 7.7% |
| Guatemalans | 0.0 /100 | #282 | Tragic 7.7% |
| Nigerians | 0.0 /100 | #283 | Tragic 7.7% |
| Immigrants | Belize | 0.0 /100 | #284 | Tragic 7.7% |
| Trinidadians and Tobagonians | 0.0 /100 | #285 | Tragic 7.7% |
| Immigrants | Middle Africa | 0.0 /100 | #286 | Tragic 7.7% |
| Immigrants | Guatemala | 0.0 /100 | #287 | Tragic 7.7% |
| Sierra Leoneans | 0.0 /100 | #288 | Tragic 7.7% |
| Sub-Saharan Africans | 0.0 /100 | #289 | Tragic 7.8% |
| Immigrants | Nigeria | 0.0 /100 | #290 | Tragic 7.8% |
| West Indians | 0.0 /100 | #291 | Tragic 7.8% |