Apache vs Immigrants from Scotland Married-couple Households
COMPARE
Apache
Immigrants from Scotland
Married-couple Households
Married-couple Households Comparison
Apache
Immigrants from Scotland
43.9%
MARRIED-COUPLE HOUSEHOLDS
0.3/ 100
METRIC RATING
254th/ 347
METRIC RANK
49.3%
MARRIED-COUPLE HOUSEHOLDS
99.8/ 100
METRIC RATING
26th/ 347
METRIC RANK
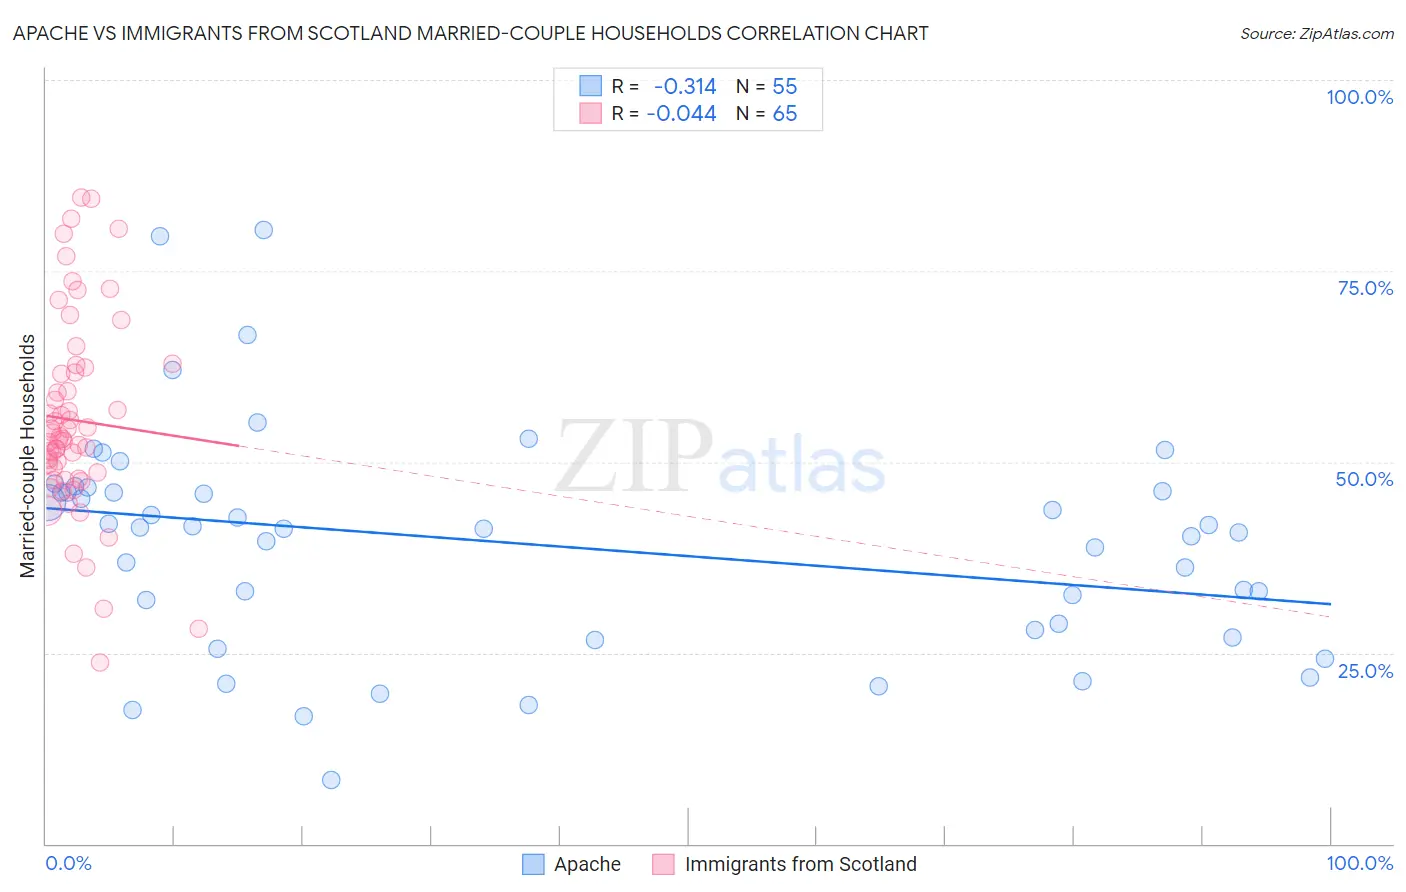
Apache vs Immigrants from Scotland Married-couple Households Correlation Chart
The statistical analysis conducted on geographies consisting of 231,040,334 people shows a mild negative correlation between the proportion of Apache and percentage of married-couple family households in the United States with a correlation coefficient (R) of -0.314 and weighted average of 43.9%. Similarly, the statistical analysis conducted on geographies consisting of 196,383,501 people shows no correlation between the proportion of Immigrants from Scotland and percentage of married-couple family households in the United States with a correlation coefficient (R) of -0.044 and weighted average of 49.3%, a difference of 12.2%.
Married-couple Households Correlation Summary
| Measurement | Apache | Immigrants from Scotland |
| Minimum | 8.3% | 23.8% |
| Maximum | 80.3% | 84.6% |
| Range | 72.0% | 60.9% |
| Mean | 39.3% | 55.5% |
| Median | 41.3% | 53.0% |
| Interquartile 25% (IQ1) | 28.0% | 48.2% |
| Interquartile 75% (IQ3) | 46.1% | 62.1% |
| Interquartile Range (IQR) | 18.1% | 13.9% |
| Standard Deviation (Sample) | 14.5% | 12.8% |
| Standard Deviation (Population) | 14.4% | 12.7% |
Similar Demographics by Married-couple Households
Demographics Similar to Apache by Married-couple Households
In terms of married-couple households, the demographic groups most similar to Apache are Shoshone (43.9%, a difference of 0.020%), Central American (43.9%, a difference of 0.050%), Ugandan (43.8%, a difference of 0.16%), Seminole (44.0%, a difference of 0.17%), and German Russian (44.0%, a difference of 0.24%).
| Demographics | Rating | Rank | Married-couple Households |
| Immigrants | Morocco | 0.6 /100 | #247 | Tragic 44.2% |
| Yup'ik | 0.4 /100 | #248 | Tragic 44.1% |
| Immigrants | Kenya | 0.4 /100 | #249 | Tragic 44.1% |
| French American Indians | 0.4 /100 | #250 | Tragic 44.1% |
| German Russians | 0.4 /100 | #251 | Tragic 44.0% |
| Seminole | 0.4 /100 | #252 | Tragic 44.0% |
| Central Americans | 0.3 /100 | #253 | Tragic 43.9% |
| Apache | 0.3 /100 | #254 | Tragic 43.9% |
| Shoshone | 0.3 /100 | #255 | Tragic 43.9% |
| Ugandans | 0.3 /100 | #256 | Tragic 43.8% |
| Blackfeet | 0.2 /100 | #257 | Tragic 43.8% |
| Central American Indians | 0.2 /100 | #258 | Tragic 43.8% |
| Iroquois | 0.2 /100 | #259 | Tragic 43.7% |
| Immigrants | Cameroon | 0.2 /100 | #260 | Tragic 43.7% |
| Alaskan Athabascans | 0.2 /100 | #261 | Tragic 43.6% |
Demographics Similar to Immigrants from Scotland by Married-couple Households
In terms of married-couple households, the demographic groups most similar to Immigrants from Scotland are Bhutanese (49.3%, a difference of 0.020%), Immigrants from Philippines (49.3%, a difference of 0.13%), German (49.2%, a difference of 0.21%), Maltese (49.2%, a difference of 0.22%), and Bolivian (49.2%, a difference of 0.23%).
| Demographics | Rating | Rank | Married-couple Households |
| Europeans | 99.9 /100 | #19 | Exceptional 49.6% |
| Scandinavians | 99.9 /100 | #20 | Exceptional 49.6% |
| Norwegians | 99.9 /100 | #21 | Exceptional 49.5% |
| Asians | 99.9 /100 | #22 | Exceptional 49.5% |
| Dutch | 99.9 /100 | #23 | Exceptional 49.5% |
| Czechs | 99.9 /100 | #24 | Exceptional 49.4% |
| Immigrants | Philippines | 99.9 /100 | #25 | Exceptional 49.3% |
| Immigrants | Scotland | 99.8 /100 | #26 | Exceptional 49.3% |
| Bhutanese | 99.8 /100 | #27 | Exceptional 49.3% |
| Germans | 99.8 /100 | #28 | Exceptional 49.2% |
| Maltese | 99.8 /100 | #29 | Exceptional 49.2% |
| Bolivians | 99.8 /100 | #30 | Exceptional 49.2% |
| Native Hawaiians | 99.8 /100 | #31 | Exceptional 49.1% |
| Hungarians | 99.8 /100 | #32 | Exceptional 49.1% |
| Immigrants | Asia | 99.7 /100 | #33 | Exceptional 49.1% |