Apache vs Immigrants from Cambodia Married-couple Households
COMPARE
Apache
Immigrants from Cambodia
Married-couple Households
Married-couple Households Comparison
Apache
Immigrants from Cambodia
43.9%
MARRIED-COUPLE HOUSEHOLDS
0.3/ 100
METRIC RATING
254th/ 347
METRIC RANK
44.9%
MARRIED-COUPLE HOUSEHOLDS
2.7/ 100
METRIC RATING
223rd/ 347
METRIC RANK
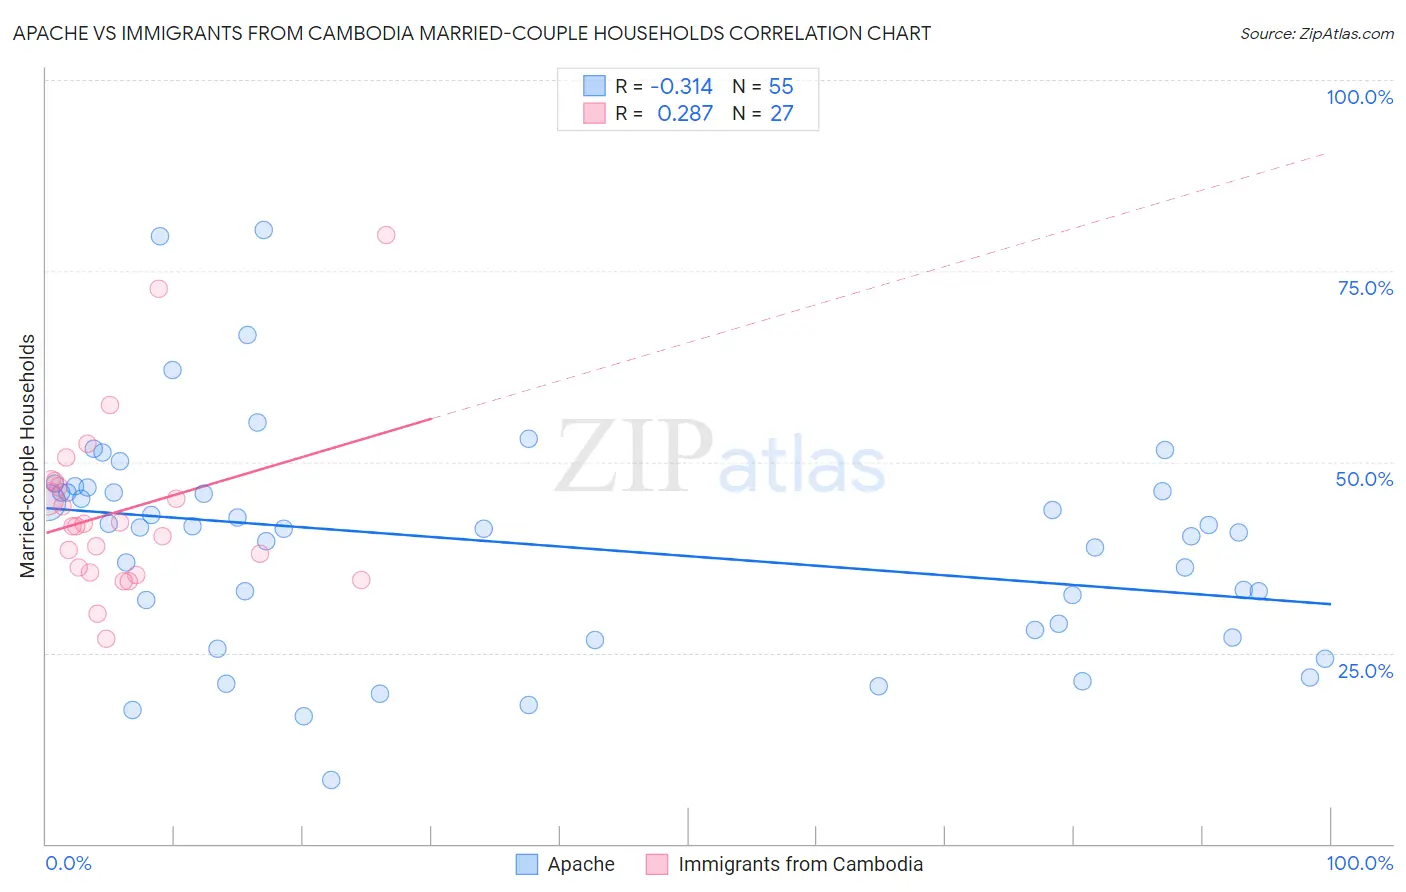
Apache vs Immigrants from Cambodia Married-couple Households Correlation Chart
The statistical analysis conducted on geographies consisting of 231,040,334 people shows a mild negative correlation between the proportion of Apache and percentage of married-couple family households in the United States with a correlation coefficient (R) of -0.314 and weighted average of 43.9%. Similarly, the statistical analysis conducted on geographies consisting of 205,129,465 people shows a weak positive correlation between the proportion of Immigrants from Cambodia and percentage of married-couple family households in the United States with a correlation coefficient (R) of 0.287 and weighted average of 44.9%, a difference of 2.2%.
Married-couple Households Correlation Summary
| Measurement | Apache | Immigrants from Cambodia |
| Minimum | 8.3% | 26.8% |
| Maximum | 80.3% | 79.6% |
| Range | 72.0% | 52.8% |
| Mean | 39.3% | 43.7% |
| Median | 41.3% | 41.6% |
| Interquartile 25% (IQ1) | 28.0% | 35.6% |
| Interquartile 75% (IQ3) | 46.1% | 47.4% |
| Interquartile Range (IQR) | 18.1% | 11.8% |
| Standard Deviation (Sample) | 14.5% | 11.6% |
| Standard Deviation (Population) | 14.4% | 11.4% |
Similar Demographics by Married-couple Households
Demographics Similar to Apache by Married-couple Households
In terms of married-couple households, the demographic groups most similar to Apache are Shoshone (43.9%, a difference of 0.020%), Central American (43.9%, a difference of 0.050%), Ugandan (43.8%, a difference of 0.16%), Seminole (44.0%, a difference of 0.17%), and German Russian (44.0%, a difference of 0.24%).
| Demographics | Rating | Rank | Married-couple Households |
| Immigrants | Morocco | 0.6 /100 | #247 | Tragic 44.2% |
| Yup'ik | 0.4 /100 | #248 | Tragic 44.1% |
| Immigrants | Kenya | 0.4 /100 | #249 | Tragic 44.1% |
| French American Indians | 0.4 /100 | #250 | Tragic 44.1% |
| German Russians | 0.4 /100 | #251 | Tragic 44.0% |
| Seminole | 0.4 /100 | #252 | Tragic 44.0% |
| Central Americans | 0.3 /100 | #253 | Tragic 43.9% |
| Apache | 0.3 /100 | #254 | Tragic 43.9% |
| Shoshone | 0.3 /100 | #255 | Tragic 43.9% |
| Ugandans | 0.3 /100 | #256 | Tragic 43.8% |
| Blackfeet | 0.2 /100 | #257 | Tragic 43.8% |
| Central American Indians | 0.2 /100 | #258 | Tragic 43.8% |
| Iroquois | 0.2 /100 | #259 | Tragic 43.7% |
| Immigrants | Cameroon | 0.2 /100 | #260 | Tragic 43.7% |
| Alaskan Athabascans | 0.2 /100 | #261 | Tragic 43.6% |
Demographics Similar to Immigrants from Cambodia by Married-couple Households
In terms of married-couple households, the demographic groups most similar to Immigrants from Cambodia are Immigrants from Micronesia (44.9%, a difference of 0.030%), Dutch West Indian (44.9%, a difference of 0.040%), Alsatian (44.8%, a difference of 0.14%), Salvadoran (44.7%, a difference of 0.33%), and Kenyan (44.7%, a difference of 0.46%).
| Demographics | Rating | Rank | Married-couple Households |
| Immigrants | Portugal | 5.6 /100 | #216 | Tragic 45.2% |
| Panamanians | 5.5 /100 | #217 | Tragic 45.2% |
| Immigrants | Azores | 5.3 /100 | #218 | Tragic 45.2% |
| Nicaraguans | 5.3 /100 | #219 | Tragic 45.2% |
| Immigrants | Thailand | 5.1 /100 | #220 | Tragic 45.2% |
| Tlingit-Haida | 4.9 /100 | #221 | Tragic 45.1% |
| Immigrants | Laos | 4.6 /100 | #222 | Tragic 45.1% |
| Immigrants | Cambodia | 2.7 /100 | #223 | Tragic 44.9% |
| Immigrants | Micronesia | 2.6 /100 | #224 | Tragic 44.9% |
| Dutch West Indians | 2.6 /100 | #225 | Tragic 44.9% |
| Alsatians | 2.3 /100 | #226 | Tragic 44.8% |
| Salvadorans | 1.9 /100 | #227 | Tragic 44.7% |
| Kenyans | 1.7 /100 | #228 | Tragic 44.7% |
| Immigrants | Latin America | 1.6 /100 | #229 | Tragic 44.7% |
| Soviet Union | 1.6 /100 | #230 | Tragic 44.6% |