Yuman vs Cheyenne 11th Grade
COMPARE
Yuman
Cheyenne
11th Grade
11th Grade Comparison
Yuman
Cheyenne
89.7%
11TH GRADE
0.0/ 100
METRIC RATING
304th/ 347
METRIC RANK
91.8%
11TH GRADE
3.3/ 100
METRIC RATING
233rd/ 347
METRIC RANK
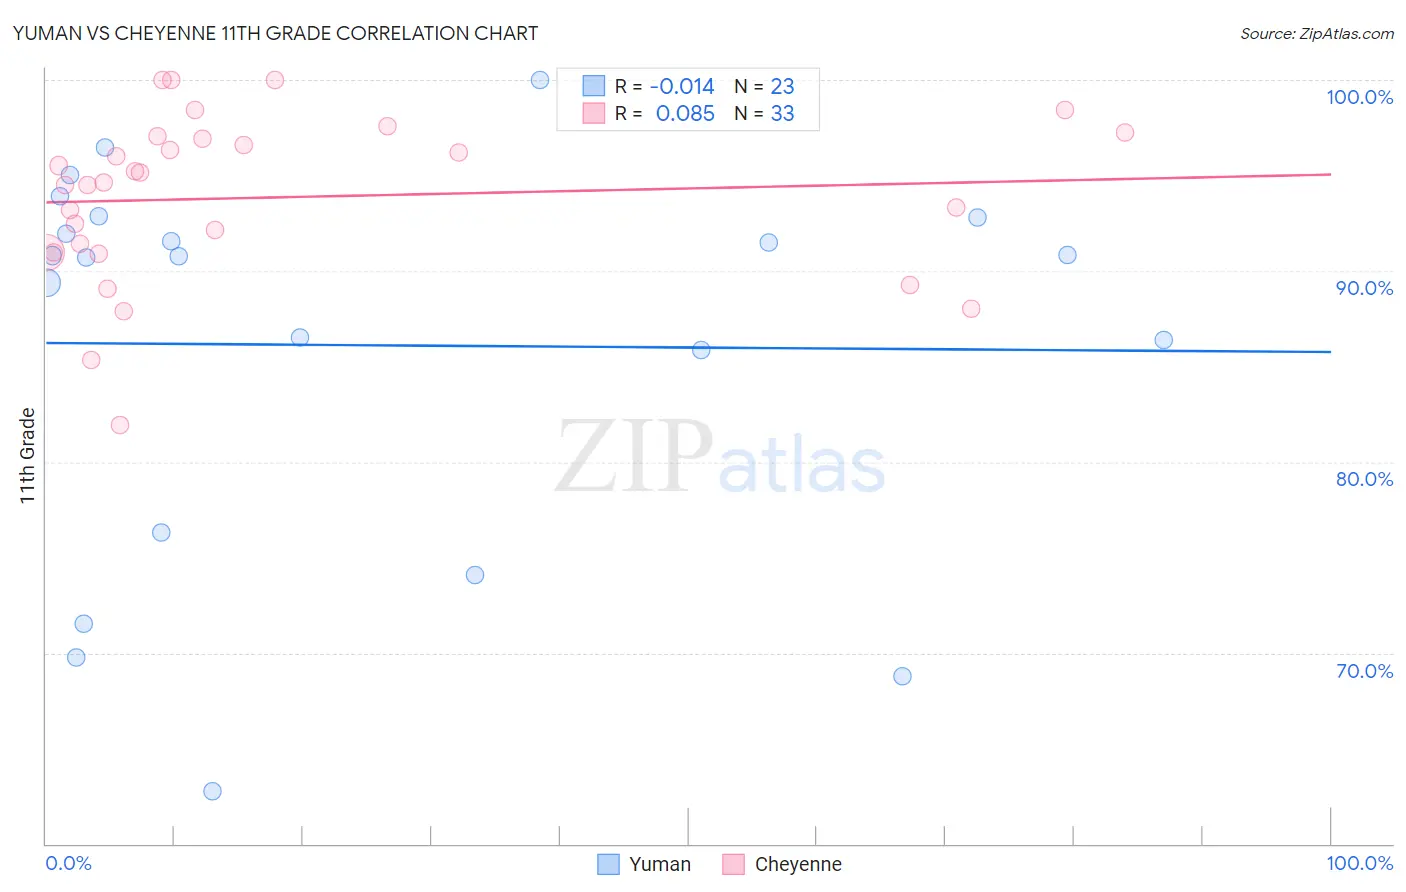
Yuman vs Cheyenne 11th Grade Correlation Chart
The statistical analysis conducted on geographies consisting of 40,696,349 people shows no correlation between the proportion of Yuman and percentage of population with at least 11th grade education in the United States with a correlation coefficient (R) of -0.014 and weighted average of 89.7%. Similarly, the statistical analysis conducted on geographies consisting of 80,719,287 people shows a slight positive correlation between the proportion of Cheyenne and percentage of population with at least 11th grade education in the United States with a correlation coefficient (R) of 0.085 and weighted average of 91.8%, a difference of 2.3%.
11th Grade Correlation Summary
| Measurement | Yuman | Cheyenne |
| Minimum | 62.7% | 81.9% |
| Maximum | 100.0% | 100.0% |
| Range | 37.3% | 18.1% |
| Mean | 86.1% | 93.9% |
| Median | 90.8% | 94.6% |
| Interquartile 25% (IQ1) | 76.3% | 91.0% |
| Interquartile 75% (IQ3) | 92.8% | 97.0% |
| Interquartile Range (IQR) | 16.5% | 6.0% |
| Standard Deviation (Sample) | 10.2% | 4.3% |
| Standard Deviation (Population) | 10.0% | 4.3% |
Similar Demographics by 11th Grade
Demographics Similar to Yuman by 11th Grade
In terms of 11th grade, the demographic groups most similar to Yuman are Immigrants (89.7%, a difference of 0.0%), Immigrants from Guyana (89.7%, a difference of 0.010%), Immigrants from Cambodia (89.6%, a difference of 0.080%), Ecuadorian (89.6%, a difference of 0.13%), and Immigrants from Dominica (89.5%, a difference of 0.18%).
| Demographics | Rating | Rank | 11th Grade |
| Navajo | 0.0 /100 | #297 | Tragic 90.0% |
| Immigrants | Fiji | 0.0 /100 | #298 | Tragic 89.9% |
| Japanese | 0.0 /100 | #299 | Tragic 89.9% |
| Immigrants | Haiti | 0.0 /100 | #300 | Tragic 89.9% |
| Guyanese | 0.0 /100 | #301 | Tragic 89.9% |
| Immigrants | Guyana | 0.0 /100 | #302 | Tragic 89.7% |
| Immigrants | Immigrants | 0.0 /100 | #303 | Tragic 89.7% |
| Yuman | 0.0 /100 | #304 | Tragic 89.7% |
| Immigrants | Cambodia | 0.0 /100 | #305 | Tragic 89.6% |
| Ecuadorians | 0.0 /100 | #306 | Tragic 89.6% |
| Immigrants | Dominica | 0.0 /100 | #307 | Tragic 89.5% |
| Nepalese | 0.0 /100 | #308 | Tragic 89.5% |
| Immigrants | Bangladesh | 0.0 /100 | #309 | Tragic 89.5% |
| Yaqui | 0.0 /100 | #310 | Tragic 89.5% |
| Vietnamese | 0.0 /100 | #311 | Tragic 89.4% |
Demographics Similar to Cheyenne by 11th Grade
In terms of 11th grade, the demographic groups most similar to Cheyenne are Uruguayan (91.8%, a difference of 0.010%), Choctaw (91.8%, a difference of 0.030%), Armenian (91.7%, a difference of 0.030%), Subsaharan African (91.7%, a difference of 0.030%), and Immigrants from Afghanistan (91.8%, a difference of 0.040%).
| Demographics | Rating | Rank | 11th Grade |
| Immigrants | Somalia | 5.2 /100 | #226 | Tragic 91.9% |
| Immigrants | Cameroon | 4.4 /100 | #227 | Tragic 91.8% |
| Immigrants | Panama | 4.3 /100 | #228 | Tragic 91.8% |
| Nigerians | 4.3 /100 | #229 | Tragic 91.8% |
| Immigrants | Afghanistan | 3.9 /100 | #230 | Tragic 91.8% |
| Choctaw | 3.7 /100 | #231 | Tragic 91.8% |
| Uruguayans | 3.5 /100 | #232 | Tragic 91.8% |
| Cheyenne | 3.3 /100 | #233 | Tragic 91.8% |
| Armenians | 2.9 /100 | #234 | Tragic 91.7% |
| Sub-Saharan Africans | 2.9 /100 | #235 | Tragic 91.7% |
| Colombians | 2.8 /100 | #236 | Tragic 91.7% |
| Immigrants | Bolivia | 2.8 /100 | #237 | Tragic 91.7% |
| Comanche | 2.6 /100 | #238 | Tragic 91.7% |
| Hopi | 2.5 /100 | #239 | Tragic 91.7% |
| South Americans | 2.0 /100 | #240 | Tragic 91.6% |