Yuman vs Immigrants from Belarus GED/Equivalency
COMPARE
Yuman
Immigrants from Belarus
GED/Equivalency
GED/Equivalency Comparison
Yuman
Immigrants from Belarus
79.2%
GED/EQUIVALENCY
0.0/ 100
METRIC RATING
326th/ 347
METRIC RANK
87.3%
GED/EQUIVALENCY
96.9/ 100
METRIC RATING
99th/ 347
METRIC RANK
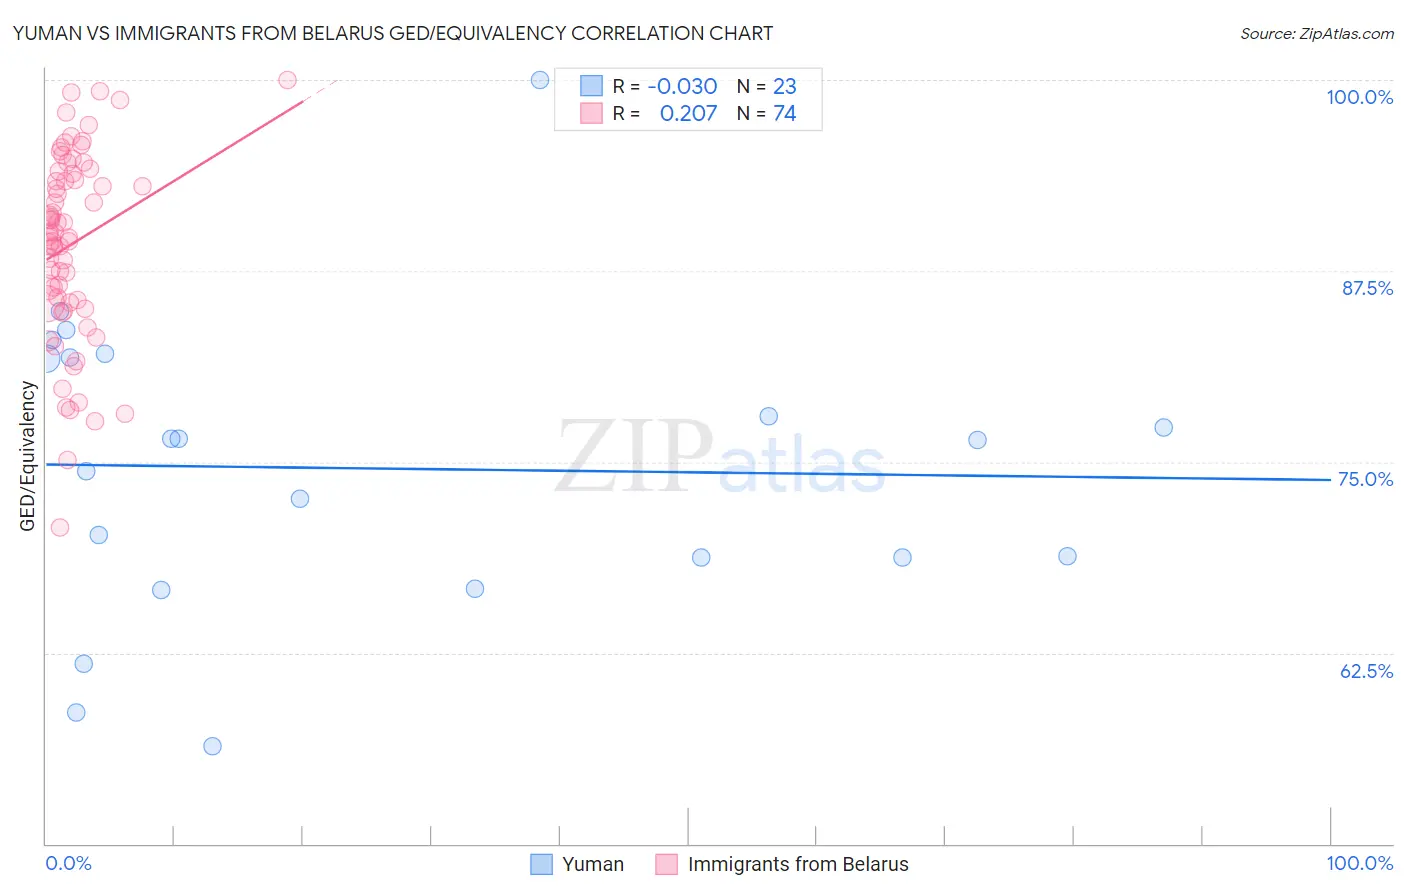
Yuman vs Immigrants from Belarus GED/Equivalency Correlation Chart
The statistical analysis conducted on geographies consisting of 40,696,349 people shows no correlation between the proportion of Yuman and percentage of population with at least ged/equivalency education in the United States with a correlation coefficient (R) of -0.030 and weighted average of 79.2%. Similarly, the statistical analysis conducted on geographies consisting of 150,205,158 people shows a weak positive correlation between the proportion of Immigrants from Belarus and percentage of population with at least ged/equivalency education in the United States with a correlation coefficient (R) of 0.207 and weighted average of 87.3%, a difference of 10.2%.
GED/Equivalency Correlation Summary
| Measurement | Yuman | Immigrants from Belarus |
| Minimum | 56.4% | 70.7% |
| Maximum | 100.0% | 100.0% |
| Range | 43.6% | 29.3% |
| Mean | 74.6% | 89.2% |
| Median | 76.5% | 89.9% |
| Interquartile 25% (IQ1) | 68.8% | 85.4% |
| Interquartile 75% (IQ3) | 81.9% | 93.9% |
| Interquartile Range (IQR) | 13.1% | 8.4% |
| Standard Deviation (Sample) | 9.8% | 6.2% |
| Standard Deviation (Population) | 9.5% | 6.1% |
Similar Demographics by GED/Equivalency
Demographics Similar to Yuman by GED/Equivalency
In terms of ged/equivalency, the demographic groups most similar to Yuman are Central American (79.2%, a difference of 0.020%), Honduran (79.3%, a difference of 0.090%), Hispanic or Latino (79.1%, a difference of 0.13%), Dominican (79.1%, a difference of 0.17%), and Mexican American Indian (79.4%, a difference of 0.21%).
| Demographics | Rating | Rank | GED/Equivalency |
| Immigrants | Belize | 0.0 /100 | #319 | Tragic 80.5% |
| Immigrants | Cuba | 0.0 /100 | #320 | Tragic 80.2% |
| Yup'ik | 0.0 /100 | #321 | Tragic 80.0% |
| Lumbee | 0.0 /100 | #322 | Tragic 80.0% |
| Immigrants | Nicaragua | 0.0 /100 | #323 | Tragic 79.9% |
| Mexican American Indians | 0.0 /100 | #324 | Tragic 79.4% |
| Hondurans | 0.0 /100 | #325 | Tragic 79.3% |
| Yuman | 0.0 /100 | #326 | Tragic 79.2% |
| Central Americans | 0.0 /100 | #327 | Tragic 79.2% |
| Hispanics or Latinos | 0.0 /100 | #328 | Tragic 79.1% |
| Dominicans | 0.0 /100 | #329 | Tragic 79.1% |
| Immigrants | Cabo Verde | 0.0 /100 | #330 | Tragic 78.9% |
| Immigrants | Honduras | 0.0 /100 | #331 | Tragic 78.7% |
| Immigrants | Azores | 0.0 /100 | #332 | Tragic 78.7% |
| Salvadorans | 0.0 /100 | #333 | Tragic 78.6% |
Demographics Similar to Immigrants from Belarus by GED/Equivalency
In terms of ged/equivalency, the demographic groups most similar to Immigrants from Belarus are Immigrants from Croatia (87.3%, a difference of 0.010%), Palestinian (87.3%, a difference of 0.020%), Syrian (87.2%, a difference of 0.050%), Immigrants from Western Europe (87.3%, a difference of 0.070%), and Lebanese (87.2%, a difference of 0.11%).
| Demographics | Rating | Rank | GED/Equivalency |
| Israelis | 97.8 /100 | #92 | Exceptional 87.4% |
| Immigrants | North Macedonia | 97.8 /100 | #93 | Exceptional 87.4% |
| Immigrants | Russia | 97.8 /100 | #94 | Exceptional 87.4% |
| Immigrants | Greece | 97.7 /100 | #95 | Exceptional 87.4% |
| Czechoslovakians | 97.6 /100 | #96 | Exceptional 87.4% |
| Immigrants | Western Europe | 97.3 /100 | #97 | Exceptional 87.3% |
| Immigrants | Croatia | 96.9 /100 | #98 | Exceptional 87.3% |
| Immigrants | Belarus | 96.9 /100 | #99 | Exceptional 87.3% |
| Palestinians | 96.8 /100 | #100 | Exceptional 87.3% |
| Syrians | 96.6 /100 | #101 | Exceptional 87.2% |
| Lebanese | 96.2 /100 | #102 | Exceptional 87.2% |
| Jordanians | 96.1 /100 | #103 | Exceptional 87.2% |
| Immigrants | Hungary | 96.0 /100 | #104 | Exceptional 87.2% |
| Indians (Asian) | 95.9 /100 | #105 | Exceptional 87.1% |
| Immigrants | Zimbabwe | 95.8 /100 | #106 | Exceptional 87.1% |