Yuman vs Immigrants from Denmark GED/Equivalency
COMPARE
Yuman
Immigrants from Denmark
GED/Equivalency
GED/Equivalency Comparison
Yuman
Immigrants from Denmark
79.2%
GED/EQUIVALENCY
0.0/ 100
METRIC RATING
326th/ 347
METRIC RANK
88.0%
GED/EQUIVALENCY
99.4/ 100
METRIC RATING
56th/ 347
METRIC RANK
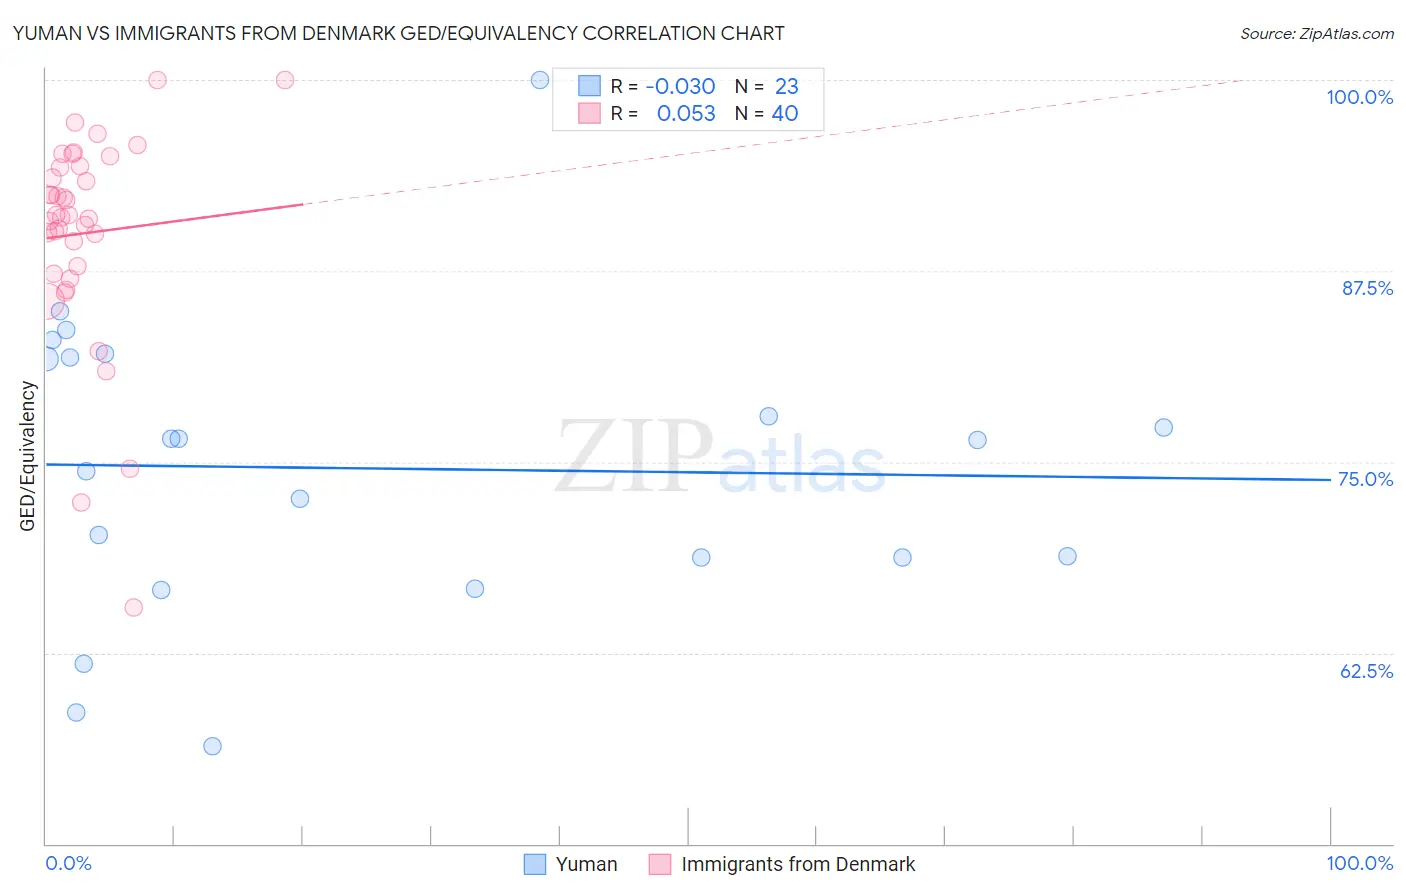
Yuman vs Immigrants from Denmark GED/Equivalency Correlation Chart
The statistical analysis conducted on geographies consisting of 40,696,349 people shows no correlation between the proportion of Yuman and percentage of population with at least ged/equivalency education in the United States with a correlation coefficient (R) of -0.030 and weighted average of 79.2%. Similarly, the statistical analysis conducted on geographies consisting of 136,430,715 people shows a slight positive correlation between the proportion of Immigrants from Denmark and percentage of population with at least ged/equivalency education in the United States with a correlation coefficient (R) of 0.053 and weighted average of 88.0%, a difference of 11.1%.
GED/Equivalency Correlation Summary
| Measurement | Yuman | Immigrants from Denmark |
| Minimum | 56.4% | 65.5% |
| Maximum | 100.0% | 100.0% |
| Range | 43.6% | 34.5% |
| Mean | 74.6% | 90.0% |
| Median | 76.5% | 91.1% |
| Interquartile 25% (IQ1) | 68.8% | 87.6% |
| Interquartile 75% (IQ3) | 81.9% | 94.3% |
| Interquartile Range (IQR) | 13.1% | 6.7% |
| Standard Deviation (Sample) | 9.8% | 7.0% |
| Standard Deviation (Population) | 9.5% | 6.9% |
Similar Demographics by GED/Equivalency
Demographics Similar to Yuman by GED/Equivalency
In terms of ged/equivalency, the demographic groups most similar to Yuman are Central American (79.2%, a difference of 0.020%), Honduran (79.3%, a difference of 0.090%), Hispanic or Latino (79.1%, a difference of 0.13%), Dominican (79.1%, a difference of 0.17%), and Mexican American Indian (79.4%, a difference of 0.21%).
| Demographics | Rating | Rank | GED/Equivalency |
| Immigrants | Belize | 0.0 /100 | #319 | Tragic 80.5% |
| Immigrants | Cuba | 0.0 /100 | #320 | Tragic 80.2% |
| Yup'ik | 0.0 /100 | #321 | Tragic 80.0% |
| Lumbee | 0.0 /100 | #322 | Tragic 80.0% |
| Immigrants | Nicaragua | 0.0 /100 | #323 | Tragic 79.9% |
| Mexican American Indians | 0.0 /100 | #324 | Tragic 79.4% |
| Hondurans | 0.0 /100 | #325 | Tragic 79.3% |
| Yuman | 0.0 /100 | #326 | Tragic 79.2% |
| Central Americans | 0.0 /100 | #327 | Tragic 79.2% |
| Hispanics or Latinos | 0.0 /100 | #328 | Tragic 79.1% |
| Dominicans | 0.0 /100 | #329 | Tragic 79.1% |
| Immigrants | Cabo Verde | 0.0 /100 | #330 | Tragic 78.9% |
| Immigrants | Honduras | 0.0 /100 | #331 | Tragic 78.7% |
| Immigrants | Azores | 0.0 /100 | #332 | Tragic 78.7% |
| Salvadorans | 0.0 /100 | #333 | Tragic 78.6% |
Demographics Similar to Immigrants from Denmark by GED/Equivalency
In terms of ged/equivalency, the demographic groups most similar to Immigrants from Denmark are Soviet Union (88.0%, a difference of 0.020%), New Zealander (88.0%, a difference of 0.020%), Immigrants from Netherlands (88.0%, a difference of 0.030%), Zimbabwean (88.0%, a difference of 0.030%), and Immigrants from South Africa (88.0%, a difference of 0.030%).
| Demographics | Rating | Rank | GED/Equivalency |
| Australians | 99.5 /100 | #49 | Exceptional 88.1% |
| Immigrants | Korea | 99.5 /100 | #50 | Exceptional 88.1% |
| Immigrants | Netherlands | 99.4 /100 | #51 | Exceptional 88.0% |
| Zimbabweans | 99.4 /100 | #52 | Exceptional 88.0% |
| Immigrants | South Africa | 99.4 /100 | #53 | Exceptional 88.0% |
| Soviet Union | 99.4 /100 | #54 | Exceptional 88.0% |
| New Zealanders | 99.4 /100 | #55 | Exceptional 88.0% |
| Immigrants | Denmark | 99.4 /100 | #56 | Exceptional 88.0% |
| Immigrants | Czechoslovakia | 99.3 /100 | #57 | Exceptional 87.9% |
| Northern Europeans | 99.3 /100 | #58 | Exceptional 87.9% |
| Serbians | 99.3 /100 | #59 | Exceptional 87.9% |
| Scandinavians | 99.3 /100 | #60 | Exceptional 87.9% |
| Europeans | 99.3 /100 | #61 | Exceptional 87.9% |
| Germans | 99.3 /100 | #62 | Exceptional 87.9% |
| Immigrants | Turkey | 99.2 /100 | #63 | Exceptional 87.9% |