Yuman vs Cheyenne Vision Disability
COMPARE
Yuman
Cheyenne
Vision Disability
Vision Disability Comparison
Yuman
Cheyenne
3.0%
VISION DISABILITY
0.0/ 100
METRIC RATING
328th/ 347
METRIC RANK
3.1%
VISION DISABILITY
0.0/ 100
METRIC RATING
334th/ 347
METRIC RANK
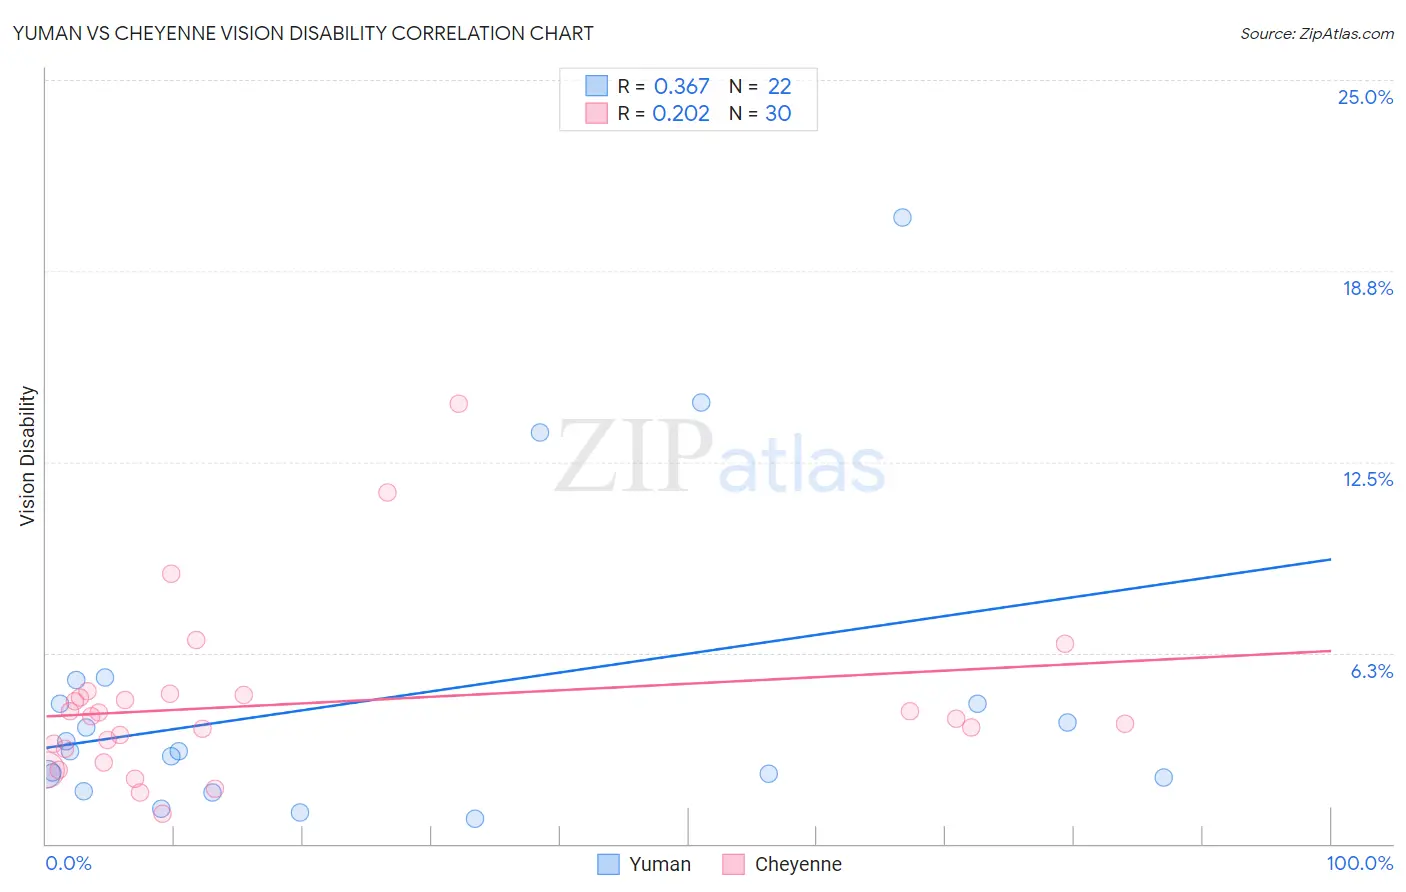
Yuman vs Cheyenne Vision Disability Correlation Chart
The statistical analysis conducted on geographies consisting of 40,661,627 people shows a mild positive correlation between the proportion of Yuman and percentage of population with vision disability in the United States with a correlation coefficient (R) of 0.367 and weighted average of 3.0%. Similarly, the statistical analysis conducted on geographies consisting of 80,705,474 people shows a weak positive correlation between the proportion of Cheyenne and percentage of population with vision disability in the United States with a correlation coefficient (R) of 0.202 and weighted average of 3.1%, a difference of 3.6%.
Vision Disability Correlation Summary
| Measurement | Yuman | Cheyenne |
| Minimum | 0.83% | 1.0% |
| Maximum | 20.5% | 14.4% |
| Range | 19.7% | 13.4% |
| Mean | 4.7% | 4.6% |
| Median | 3.0% | 4.1% |
| Interquartile 25% (IQ1) | 2.2% | 3.1% |
| Interquartile 75% (IQ3) | 4.6% | 4.9% |
| Interquartile Range (IQR) | 2.4% | 1.7% |
| Standard Deviation (Sample) | 5.0% | 2.8% |
| Standard Deviation (Population) | 4.9% | 2.8% |
Demographics Similar to Yuman and Cheyenne by Vision Disability
In terms of vision disability, the demographic groups most similar to Yuman are Apache (3.0%, a difference of 0.19%), Native/Alaskan (3.0%, a difference of 0.54%), Spanish American (2.9%, a difference of 1.3%), Colville (3.0%, a difference of 1.4%), and Central American Indian (3.0%, a difference of 2.1%). Similarly, the demographic groups most similar to Cheyenne are Cajun (3.1%, a difference of 1.1%), Seminole (3.1%, a difference of 1.1%), Central American Indian (3.0%, a difference of 1.5%), Navajo (3.1%, a difference of 1.7%), and Alaskan Athabascan (3.1%, a difference of 1.8%).
| Demographics | Rating | Rank | Vision Disability |
| Comanche | 0.0 /100 | #321 | Tragic 2.8% |
| Paiute | 0.0 /100 | #322 | Tragic 2.9% |
| Tlingit-Haida | 0.0 /100 | #323 | Tragic 2.9% |
| Hopi | 0.0 /100 | #324 | Tragic 2.9% |
| Cherokee | 0.0 /100 | #325 | Tragic 2.9% |
| Spanish Americans | 0.0 /100 | #326 | Tragic 2.9% |
| Natives/Alaskans | 0.0 /100 | #327 | Tragic 3.0% |
| Yuman | 0.0 /100 | #328 | Tragic 3.0% |
| Apache | 0.0 /100 | #329 | Tragic 3.0% |
| Colville | 0.0 /100 | #330 | Tragic 3.0% |
| Central American Indians | 0.0 /100 | #331 | Tragic 3.0% |
| Seminole | 0.0 /100 | #332 | Tragic 3.1% |
| Cajuns | 0.0 /100 | #333 | Tragic 3.1% |
| Cheyenne | 0.0 /100 | #334 | Tragic 3.1% |
| Navajo | 0.0 /100 | #335 | Tragic 3.1% |
| Alaskan Athabascans | 0.0 /100 | #336 | Tragic 3.1% |
| Dutch West Indians | 0.0 /100 | #337 | Tragic 3.2% |
| Chickasaw | 0.0 /100 | #338 | Tragic 3.2% |
| Tsimshian | 0.0 /100 | #339 | Tragic 3.2% |
| Creek | 0.0 /100 | #340 | Tragic 3.2% |
| Kiowa | 0.0 /100 | #341 | Tragic 3.3% |