Yuman vs Tlingit-Haida GED/Equivalency
COMPARE
Yuman
Tlingit-Haida
GED/Equivalency
GED/Equivalency Comparison
Yuman
Tlingit-Haida
79.2%
GED/EQUIVALENCY
0.0/ 100
METRIC RATING
326th/ 347
METRIC RANK
87.0%
GED/EQUIVALENCY
94.8/ 100
METRIC RATING
112th/ 347
METRIC RANK
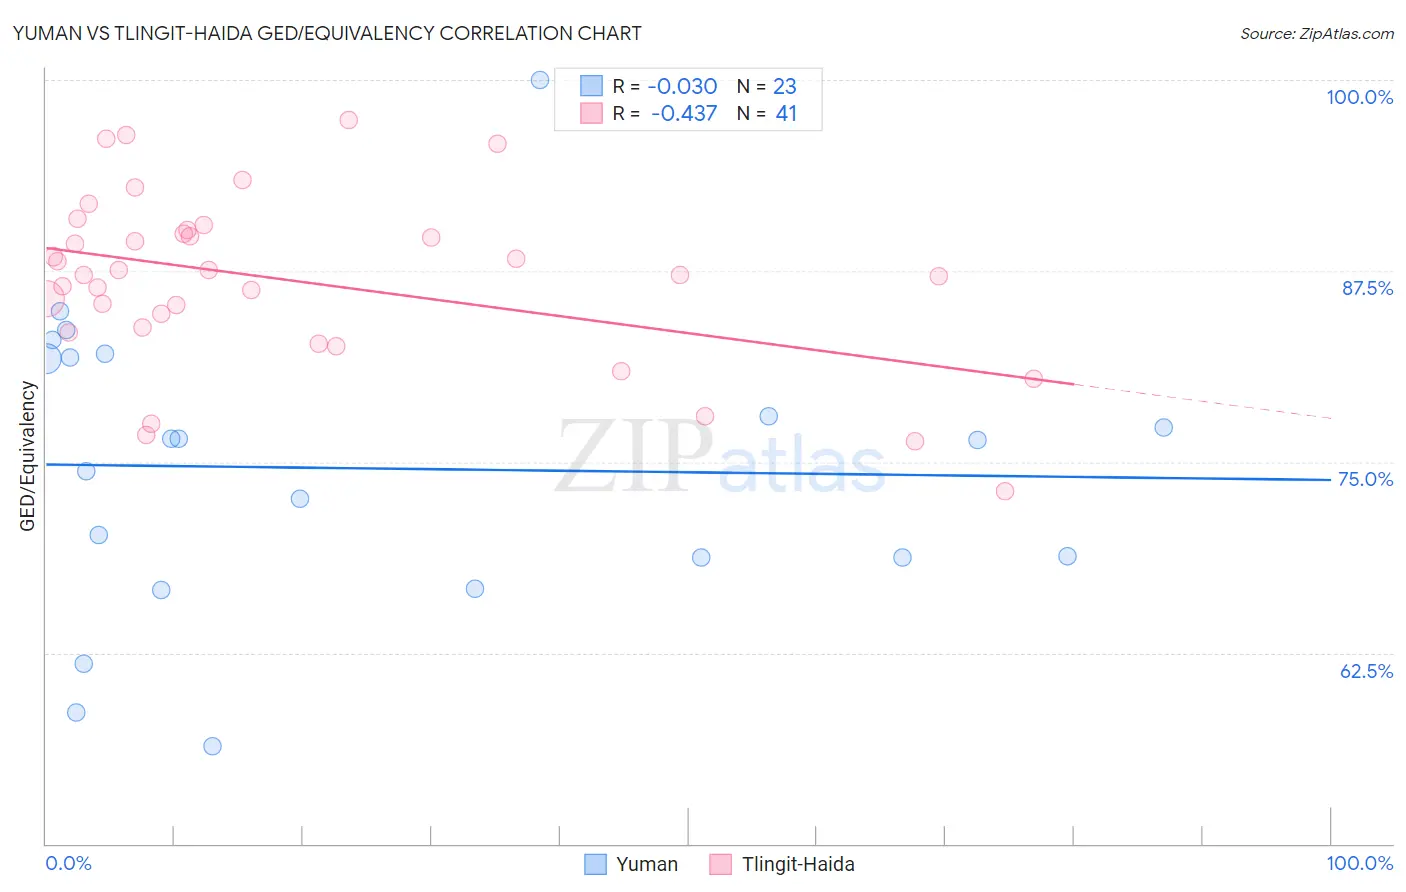
Yuman vs Tlingit-Haida GED/Equivalency Correlation Chart
The statistical analysis conducted on geographies consisting of 40,696,349 people shows no correlation between the proportion of Yuman and percentage of population with at least ged/equivalency education in the United States with a correlation coefficient (R) of -0.030 and weighted average of 79.2%. Similarly, the statistical analysis conducted on geographies consisting of 60,871,919 people shows a moderate negative correlation between the proportion of Tlingit-Haida and percentage of population with at least ged/equivalency education in the United States with a correlation coefficient (R) of -0.437 and weighted average of 87.0%, a difference of 9.9%.
GED/Equivalency Correlation Summary
| Measurement | Yuman | Tlingit-Haida |
| Minimum | 56.4% | 73.1% |
| Maximum | 100.0% | 97.4% |
| Range | 43.6% | 24.3% |
| Mean | 74.6% | 86.9% |
| Median | 76.5% | 87.2% |
| Interquartile 25% (IQ1) | 68.8% | 83.6% |
| Interquartile 75% (IQ3) | 81.9% | 90.1% |
| Interquartile Range (IQR) | 13.1% | 6.4% |
| Standard Deviation (Sample) | 9.8% | 5.6% |
| Standard Deviation (Population) | 9.5% | 5.6% |
Similar Demographics by GED/Equivalency
Demographics Similar to Yuman by GED/Equivalency
In terms of ged/equivalency, the demographic groups most similar to Yuman are Central American (79.2%, a difference of 0.020%), Honduran (79.3%, a difference of 0.090%), Hispanic or Latino (79.1%, a difference of 0.13%), Dominican (79.1%, a difference of 0.17%), and Mexican American Indian (79.4%, a difference of 0.21%).
| Demographics | Rating | Rank | GED/Equivalency |
| Immigrants | Belize | 0.0 /100 | #319 | Tragic 80.5% |
| Immigrants | Cuba | 0.0 /100 | #320 | Tragic 80.2% |
| Yup'ik | 0.0 /100 | #321 | Tragic 80.0% |
| Lumbee | 0.0 /100 | #322 | Tragic 80.0% |
| Immigrants | Nicaragua | 0.0 /100 | #323 | Tragic 79.9% |
| Mexican American Indians | 0.0 /100 | #324 | Tragic 79.4% |
| Hondurans | 0.0 /100 | #325 | Tragic 79.3% |
| Yuman | 0.0 /100 | #326 | Tragic 79.2% |
| Central Americans | 0.0 /100 | #327 | Tragic 79.2% |
| Hispanics or Latinos | 0.0 /100 | #328 | Tragic 79.1% |
| Dominicans | 0.0 /100 | #329 | Tragic 79.1% |
| Immigrants | Cabo Verde | 0.0 /100 | #330 | Tragic 78.9% |
| Immigrants | Honduras | 0.0 /100 | #331 | Tragic 78.7% |
| Immigrants | Azores | 0.0 /100 | #332 | Tragic 78.7% |
| Salvadorans | 0.0 /100 | #333 | Tragic 78.6% |
Demographics Similar to Tlingit-Haida by GED/Equivalency
In terms of ged/equivalency, the demographic groups most similar to Tlingit-Haida are Assyrian/Chaldean/Syriac (87.0%, a difference of 0.0%), Immigrants from Kazakhstan (87.0%, a difference of 0.010%), Mongolian (87.0%, a difference of 0.020%), Swiss (87.0%, a difference of 0.030%), and Egyptian (87.1%, a difference of 0.050%).
| Demographics | Rating | Rank | GED/Equivalency |
| Indians (Asian) | 95.9 /100 | #105 | Exceptional 87.1% |
| Immigrants | Zimbabwe | 95.8 /100 | #106 | Exceptional 87.1% |
| Icelanders | 95.7 /100 | #107 | Exceptional 87.1% |
| Canadians | 95.6 /100 | #108 | Exceptional 87.1% |
| Immigrants | Eastern Europe | 95.5 /100 | #109 | Exceptional 87.1% |
| Egyptians | 95.3 /100 | #110 | Exceptional 87.1% |
| French | 95.2 /100 | #111 | Exceptional 87.1% |
| Tlingit-Haida | 94.8 /100 | #112 | Exceptional 87.0% |
| Assyrians/Chaldeans/Syriacs | 94.8 /100 | #113 | Exceptional 87.0% |
| Immigrants | Kazakhstan | 94.7 /100 | #114 | Exceptional 87.0% |
| Mongolians | 94.6 /100 | #115 | Exceptional 87.0% |
| Swiss | 94.5 /100 | #116 | Exceptional 87.0% |
| Immigrants | Hong Kong | 93.8 /100 | #117 | Exceptional 86.9% |
| French Canadians | 93.2 /100 | #118 | Exceptional 86.9% |
| Immigrants | China | 93.2 /100 | #119 | Exceptional 86.9% |