Yuman vs Cheyenne Female Poverty Among 25-34 Year Olds
COMPARE
Yuman
Cheyenne
Female Poverty Among 25-34 Year Olds
Female Poverty Among 25-34 Year Olds Comparison
Yuman
Cheyenne
22.9%
FEMALE POVERTY AMONG 25-34 YEAR OLDS
0.0/ 100
METRIC RATING
339th/ 347
METRIC RANK
19.1%
FEMALE POVERTY AMONG 25-34 YEAR OLDS
0.0/ 100
METRIC RATING
327th/ 347
METRIC RANK
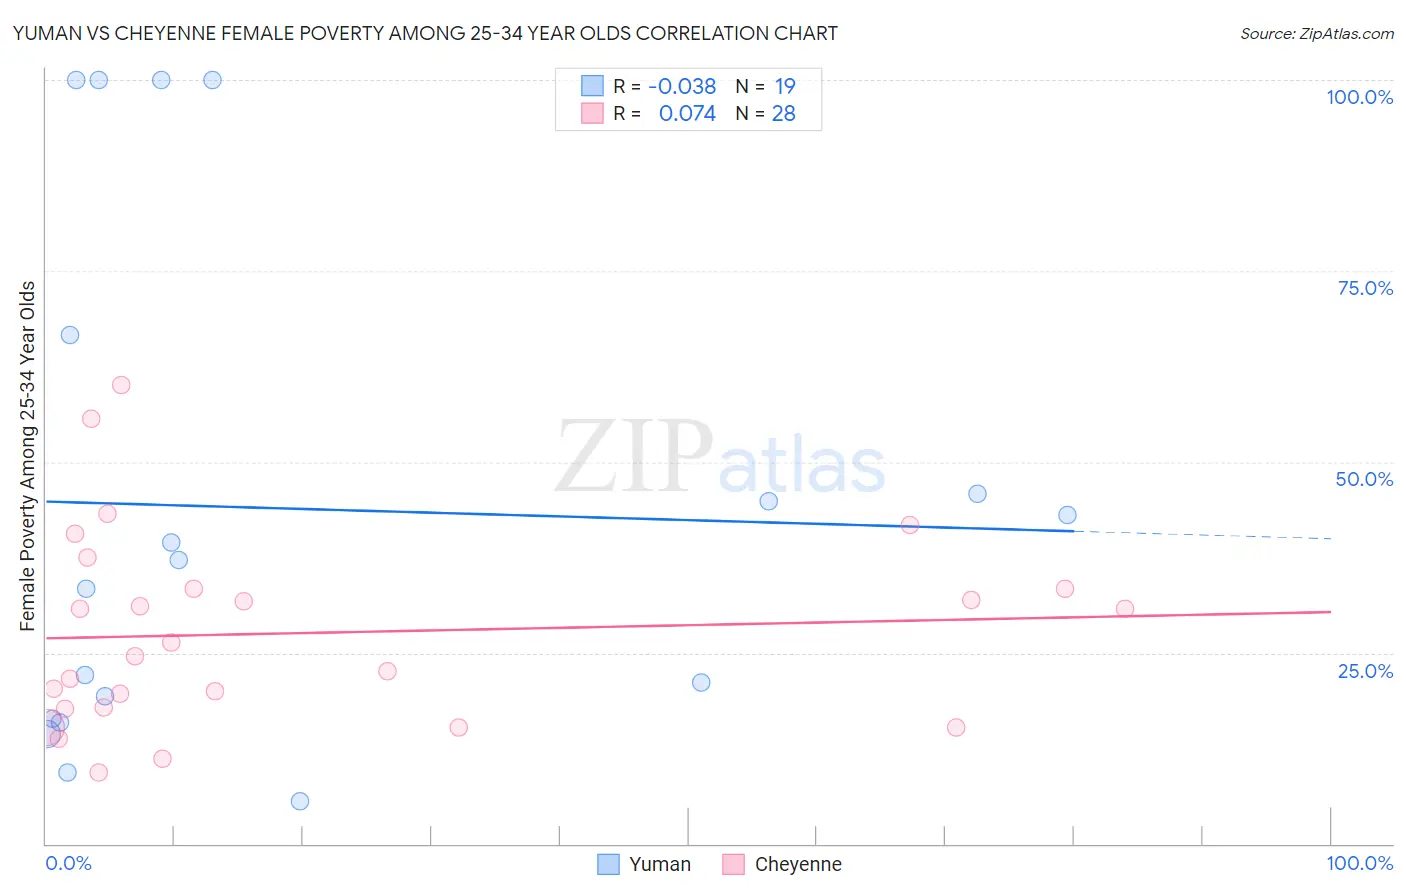
Yuman vs Cheyenne Female Poverty Among 25-34 Year Olds Correlation Chart
The statistical analysis conducted on geographies consisting of 40,634,660 people shows no correlation between the proportion of Yuman and poverty level among females between the ages 25 and 34 in the United States with a correlation coefficient (R) of -0.038 and weighted average of 22.9%. Similarly, the statistical analysis conducted on geographies consisting of 80,457,436 people shows a slight positive correlation between the proportion of Cheyenne and poverty level among females between the ages 25 and 34 in the United States with a correlation coefficient (R) of 0.074 and weighted average of 19.1%, a difference of 20.0%.
Female Poverty Among 25-34 Year Olds Correlation Summary
| Measurement | Yuman | Cheyenne |
| Minimum | 5.6% | 9.4% |
| Maximum | 100.0% | 60.0% |
| Range | 94.4% | 50.6% |
| Mean | 43.9% | 27.6% |
| Median | 37.2% | 25.4% |
| Interquartile 25% (IQ1) | 16.4% | 17.7% |
| Interquartile 75% (IQ3) | 66.7% | 33.3% |
| Interquartile Range (IQR) | 50.3% | 15.6% |
| Standard Deviation (Sample) | 33.3% | 12.7% |
| Standard Deviation (Population) | 32.4% | 12.5% |
Demographics Similar to Yuman and Cheyenne by Female Poverty Among 25-34 Year Olds
In terms of female poverty among 25-34 year olds, the demographic groups most similar to Yuman are Sioux (23.0%, a difference of 0.18%), Houma (22.7%, a difference of 0.85%), Crow (22.7%, a difference of 1.0%), Navajo (23.3%, a difference of 1.9%), and Hopi (23.7%, a difference of 3.3%). Similarly, the demographic groups most similar to Cheyenne are Alaskan Athabascan (19.1%, a difference of 0.080%), Creek (19.2%, a difference of 0.33%), Black/African American (18.9%, a difference of 0.96%), Paiute (19.6%, a difference of 2.6%), and Kiowa (19.7%, a difference of 3.0%).
| Demographics | Rating | Rank | Female Poverty Among 25-34 Year Olds |
| Seminole | 0.0 /100 | #323 | Tragic 18.3% |
| Dutch West Indians | 0.0 /100 | #324 | Tragic 18.4% |
| Inupiat | 0.0 /100 | #325 | Tragic 18.5% |
| Blacks/African Americans | 0.0 /100 | #326 | Tragic 18.9% |
| Cheyenne | 0.0 /100 | #327 | Tragic 19.1% |
| Alaskan Athabascans | 0.0 /100 | #328 | Tragic 19.1% |
| Creek | 0.0 /100 | #329 | Tragic 19.2% |
| Paiute | 0.0 /100 | #330 | Tragic 19.6% |
| Kiowa | 0.0 /100 | #331 | Tragic 19.7% |
| Immigrants | Yemen | 0.0 /100 | #332 | Tragic 19.8% |
| Cajuns | 0.0 /100 | #333 | Tragic 19.9% |
| Apache | 0.0 /100 | #334 | Tragic 20.1% |
| Natives/Alaskans | 0.0 /100 | #335 | Tragic 20.3% |
| Pueblo | 0.0 /100 | #336 | Tragic 22.2% |
| Crow | 0.0 /100 | #337 | Tragic 22.7% |
| Houma | 0.0 /100 | #338 | Tragic 22.7% |
| Yuman | 0.0 /100 | #339 | Tragic 22.9% |
| Sioux | 0.0 /100 | #340 | Tragic 23.0% |
| Navajo | 0.0 /100 | #341 | Tragic 23.3% |
| Hopi | 0.0 /100 | #342 | Tragic 23.7% |
| Yup'ik | 0.0 /100 | #343 | Tragic 24.3% |