Yakama vs Uruguayan College, 1 year or more
COMPARE
Yakama
Uruguayan
College, 1 year or more
College, 1 year or more Comparison
Yakama
Uruguayans
46.2%
COLLEGE, 1 YEAR OR MORE
0.0/ 100
METRIC RATING
344th/ 347
METRIC RANK
58.8%
COLLEGE, 1 YEAR OR MORE
31.8/ 100
METRIC RATING
189th/ 347
METRIC RANK
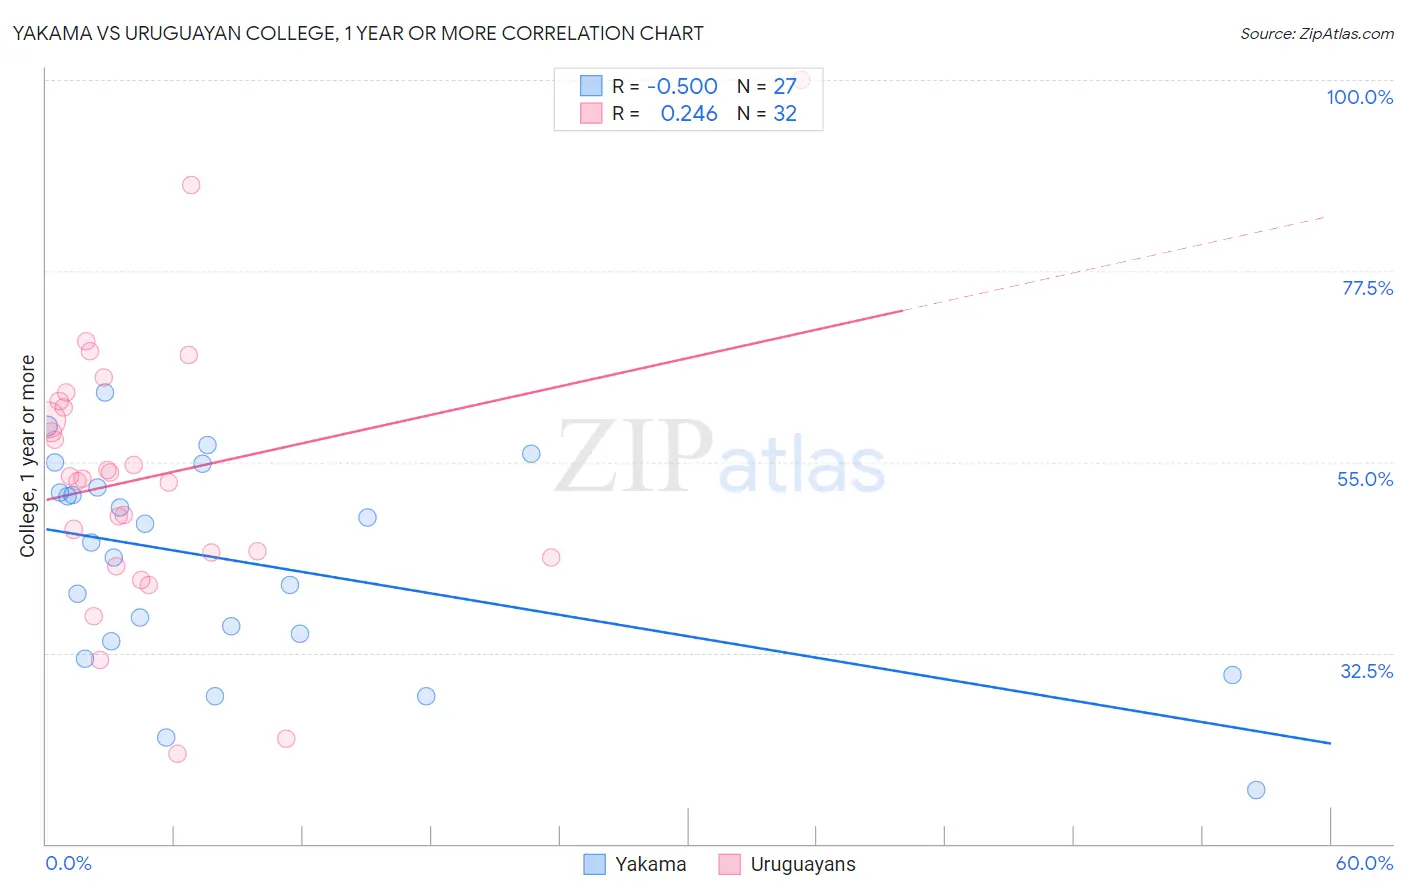
Yakama vs Uruguayan College, 1 year or more Correlation Chart
The statistical analysis conducted on geographies consisting of 19,923,144 people shows a moderate negative correlation between the proportion of Yakama and percentage of population with at least college, 1 year or more education in the United States with a correlation coefficient (R) of -0.500 and weighted average of 46.2%. Similarly, the statistical analysis conducted on geographies consisting of 144,782,794 people shows a weak positive correlation between the proportion of Uruguayans and percentage of population with at least college, 1 year or more education in the United States with a correlation coefficient (R) of 0.246 and weighted average of 58.8%, a difference of 27.3%.
College, 1 year or more Correlation Summary
| Measurement | Yakama | Uruguayan |
| Minimum | 16.3% | 20.6% |
| Maximum | 63.1% | 100.0% |
| Range | 46.8% | 79.4% |
| Mean | 43.0% | 53.3% |
| Median | 45.5% | 53.2% |
| Interquartile 25% (IQ1) | 33.9% | 44.0% |
| Interquartile 75% (IQ3) | 52.0% | 61.8% |
| Interquartile Range (IQR) | 18.1% | 17.8% |
| Standard Deviation (Sample) | 12.2% | 16.1% |
| Standard Deviation (Population) | 12.0% | 15.8% |
Similar Demographics by College, 1 year or more
Demographics Similar to Yakama by College, 1 year or more
In terms of college, 1 year or more, the demographic groups most similar to Yakama are Pima (45.6%, a difference of 1.3%), Tohono O'odham (47.1%, a difference of 2.0%), Inupiat (47.2%, a difference of 2.2%), Immigrants from Mexico (47.5%, a difference of 2.8%), and Immigrants from Cabo Verde (48.1%, a difference of 4.0%).
| Demographics | Rating | Rank | College, 1 year or more |
| Immigrants | Dominican Republic | 0.0 /100 | #333 | Tragic 49.1% |
| Lumbee | 0.0 /100 | #334 | Tragic 48.9% |
| Yuman | 0.0 /100 | #335 | Tragic 48.7% |
| Spanish American Indians | 0.0 /100 | #336 | Tragic 48.5% |
| Pennsylvania Germans | 0.0 /100 | #337 | Tragic 48.5% |
| Immigrants | Central America | 0.0 /100 | #338 | Tragic 48.5% |
| Immigrants | Azores | 0.0 /100 | #339 | Tragic 48.4% |
| Immigrants | Cabo Verde | 0.0 /100 | #340 | Tragic 48.1% |
| Immigrants | Mexico | 0.0 /100 | #341 | Tragic 47.5% |
| Inupiat | 0.0 /100 | #342 | Tragic 47.2% |
| Tohono O'odham | 0.0 /100 | #343 | Tragic 47.1% |
| Yakama | 0.0 /100 | #344 | Tragic 46.2% |
| Pima | 0.0 /100 | #345 | Tragic 45.6% |
| Houma | 0.0 /100 | #346 | Tragic 41.2% |
| Yup'ik | 0.0 /100 | #347 | Tragic 39.4% |
Demographics Similar to Uruguayans by College, 1 year or more
In terms of college, 1 year or more, the demographic groups most similar to Uruguayans are Immigrants from Cameroon (58.8%, a difference of 0.040%), French (58.9%, a difference of 0.15%), German (58.9%, a difference of 0.17%), Immigrants from Philippines (58.7%, a difference of 0.17%), and Scotch-Irish (58.9%, a difference of 0.18%).
| Demographics | Rating | Rank | College, 1 year or more |
| Immigrants | Bosnia and Herzegovina | 42.8 /100 | #182 | Average 59.2% |
| German Russians | 39.3 /100 | #183 | Fair 59.1% |
| Spaniards | 38.3 /100 | #184 | Fair 59.0% |
| South Americans | 35.9 /100 | #185 | Fair 59.0% |
| Scotch-Irish | 34.7 /100 | #186 | Fair 58.9% |
| Germans | 34.7 /100 | #187 | Fair 58.9% |
| French | 34.4 /100 | #188 | Fair 58.9% |
| Uruguayans | 31.8 /100 | #189 | Fair 58.8% |
| Immigrants | Cameroon | 31.2 /100 | #190 | Fair 58.8% |
| Immigrants | Philippines | 29.2 /100 | #191 | Fair 58.7% |
| Colombians | 27.6 /100 | #192 | Fair 58.7% |
| Peruvians | 27.5 /100 | #193 | Fair 58.6% |
| Costa Ricans | 26.4 /100 | #194 | Fair 58.6% |
| Dutch | 26.2 /100 | #195 | Fair 58.6% |
| Guamanians/Chamorros | 26.2 /100 | #196 | Fair 58.6% |