Yakama vs Moroccan College, 1 year or more
COMPARE
Yakama
Moroccan
College, 1 year or more
College, 1 year or more Comparison
Yakama
Moroccans
46.2%
COLLEGE, 1 YEAR OR MORE
0.0/ 100
METRIC RATING
344th/ 347
METRIC RANK
60.2%
COLLEGE, 1 YEAR OR MORE
72.9/ 100
METRIC RATING
155th/ 347
METRIC RANK
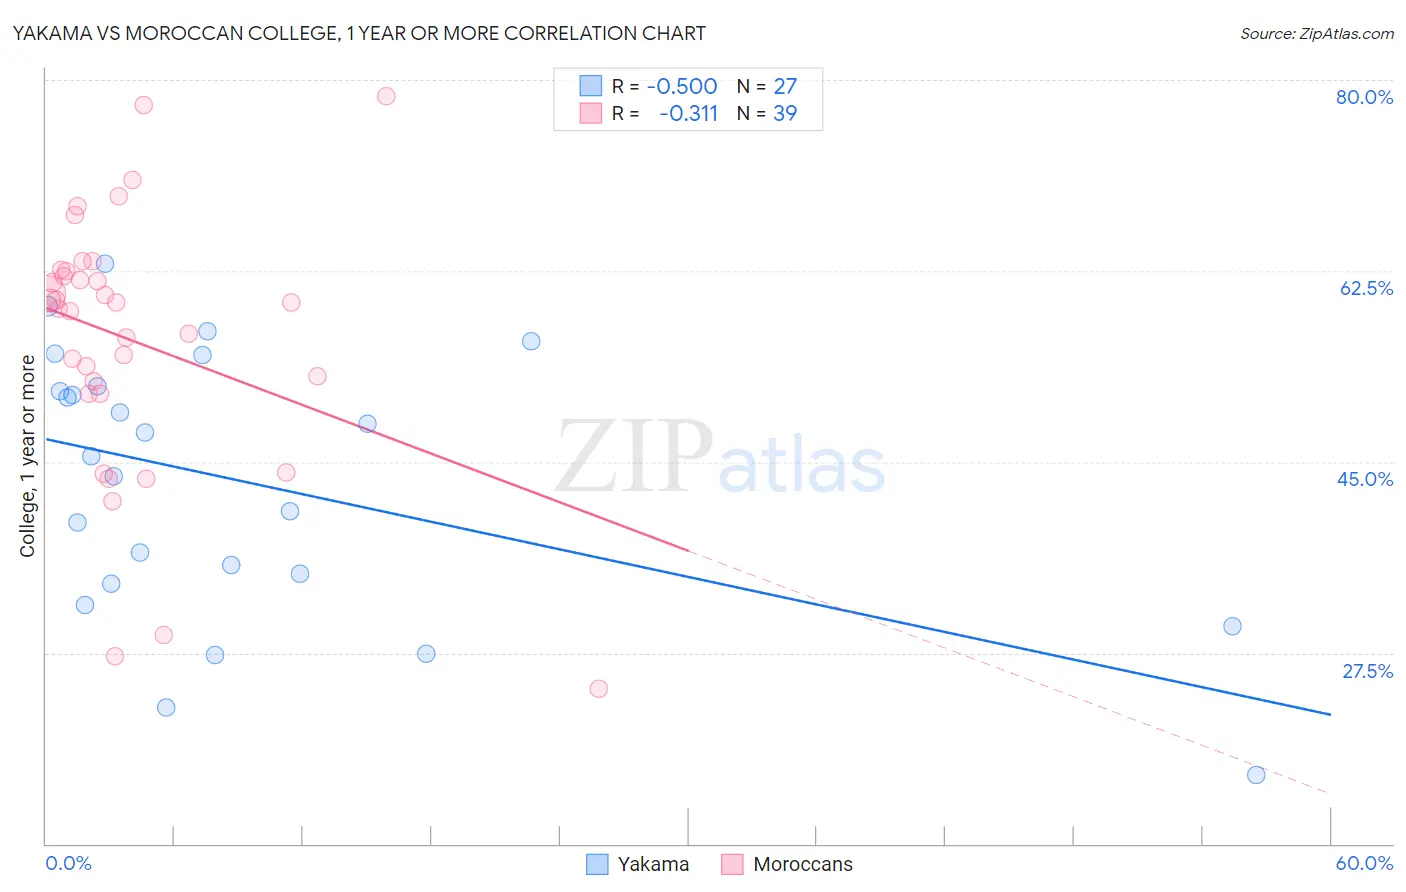
Yakama vs Moroccan College, 1 year or more Correlation Chart
The statistical analysis conducted on geographies consisting of 19,923,144 people shows a moderate negative correlation between the proportion of Yakama and percentage of population with at least college, 1 year or more education in the United States with a correlation coefficient (R) of -0.500 and weighted average of 46.2%. Similarly, the statistical analysis conducted on geographies consisting of 201,817,667 people shows a mild negative correlation between the proportion of Moroccans and percentage of population with at least college, 1 year or more education in the United States with a correlation coefficient (R) of -0.311 and weighted average of 60.2%, a difference of 30.2%.
College, 1 year or more Correlation Summary
| Measurement | Yakama | Moroccan |
| Minimum | 16.3% | 24.2% |
| Maximum | 63.1% | 78.5% |
| Range | 46.8% | 54.2% |
| Mean | 43.0% | 56.1% |
| Median | 45.5% | 59.6% |
| Interquartile 25% (IQ1) | 33.9% | 51.3% |
| Interquartile 75% (IQ3) | 52.0% | 62.5% |
| Interquartile Range (IQR) | 18.1% | 11.2% |
| Standard Deviation (Sample) | 12.2% | 12.1% |
| Standard Deviation (Population) | 12.0% | 11.9% |
Similar Demographics by College, 1 year or more
Demographics Similar to Yakama by College, 1 year or more
In terms of college, 1 year or more, the demographic groups most similar to Yakama are Pima (45.6%, a difference of 1.3%), Tohono O'odham (47.1%, a difference of 2.0%), Inupiat (47.2%, a difference of 2.2%), Immigrants from Mexico (47.5%, a difference of 2.8%), and Immigrants from Cabo Verde (48.1%, a difference of 4.0%).
| Demographics | Rating | Rank | College, 1 year or more |
| Immigrants | Dominican Republic | 0.0 /100 | #333 | Tragic 49.1% |
| Lumbee | 0.0 /100 | #334 | Tragic 48.9% |
| Yuman | 0.0 /100 | #335 | Tragic 48.7% |
| Spanish American Indians | 0.0 /100 | #336 | Tragic 48.5% |
| Pennsylvania Germans | 0.0 /100 | #337 | Tragic 48.5% |
| Immigrants | Central America | 0.0 /100 | #338 | Tragic 48.5% |
| Immigrants | Azores | 0.0 /100 | #339 | Tragic 48.4% |
| Immigrants | Cabo Verde | 0.0 /100 | #340 | Tragic 48.1% |
| Immigrants | Mexico | 0.0 /100 | #341 | Tragic 47.5% |
| Inupiat | 0.0 /100 | #342 | Tragic 47.2% |
| Tohono O'odham | 0.0 /100 | #343 | Tragic 47.1% |
| Yakama | 0.0 /100 | #344 | Tragic 46.2% |
| Pima | 0.0 /100 | #345 | Tragic 45.6% |
| Houma | 0.0 /100 | #346 | Tragic 41.2% |
| Yup'ik | 0.0 /100 | #347 | Tragic 39.4% |
Demographics Similar to Moroccans by College, 1 year or more
In terms of college, 1 year or more, the demographic groups most similar to Moroccans are Sudanese (60.2%, a difference of 0.0%), Finnish (60.2%, a difference of 0.0%), Sierra Leonean (60.2%, a difference of 0.080%), Immigrants from Germany (60.3%, a difference of 0.22%), and Immigrants from Armenia (60.0%, a difference of 0.26%).
| Demographics | Rating | Rank | College, 1 year or more |
| Kenyans | 79.0 /100 | #148 | Good 60.5% |
| Brazilians | 79.0 /100 | #149 | Good 60.5% |
| Immigrants | Sudan | 77.8 /100 | #150 | Good 60.4% |
| Albanians | 77.8 /100 | #151 | Good 60.4% |
| Immigrants | Germany | 76.1 /100 | #152 | Good 60.3% |
| Sierra Leoneans | 74.1 /100 | #153 | Good 60.2% |
| Sudanese | 73.0 /100 | #154 | Good 60.2% |
| Moroccans | 72.9 /100 | #155 | Good 60.2% |
| Finns | 72.9 /100 | #156 | Good 60.2% |
| Immigrants | Armenia | 68.8 /100 | #157 | Good 60.0% |
| English | 67.2 /100 | #158 | Good 60.0% |
| Immigrants | Iraq | 67.0 /100 | #159 | Good 60.0% |
| South American Indians | 66.9 /100 | #160 | Good 60.0% |
| Somalis | 64.5 /100 | #161 | Good 59.9% |
| Koreans | 58.5 /100 | #162 | Average 59.7% |