Scottish vs Immigrants from Grenada College, 1 year or more
COMPARE
Scottish
Immigrants from Grenada
College, 1 year or more
College, 1 year or more Comparison
Scottish
Immigrants from Grenada
60.5%
COLLEGE, 1 YEAR OR MORE
80.2/ 100
METRIC RATING
146th/ 347
METRIC RANK
54.4%
COLLEGE, 1 YEAR OR MORE
0.2/ 100
METRIC RATING
273rd/ 347
METRIC RANK
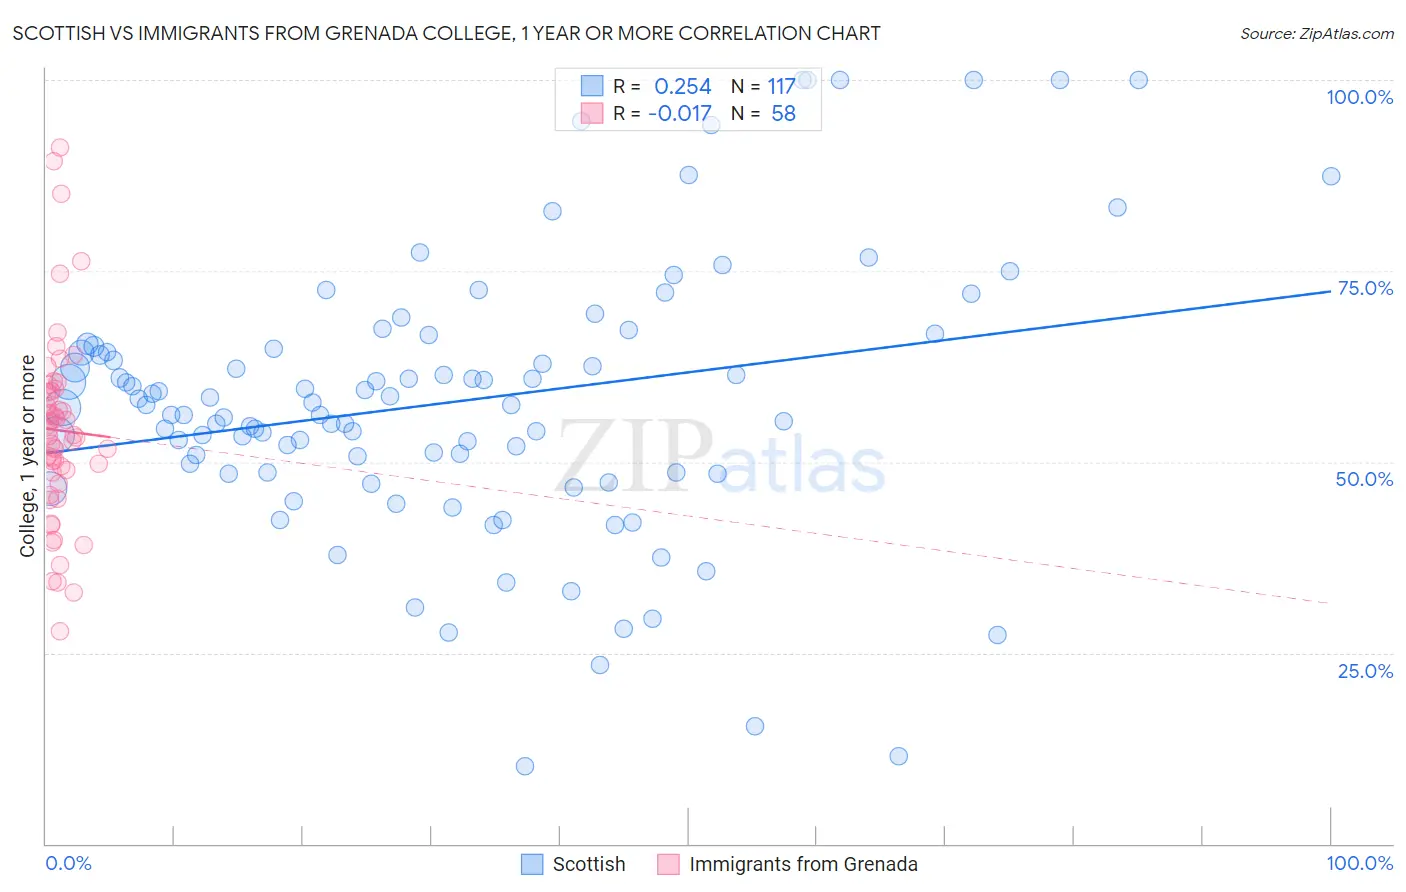
Scottish vs Immigrants from Grenada College, 1 year or more Correlation Chart
The statistical analysis conducted on geographies consisting of 567,133,506 people shows a weak positive correlation between the proportion of Scottish and percentage of population with at least college, 1 year or more education in the United States with a correlation coefficient (R) of 0.254 and weighted average of 60.5%. Similarly, the statistical analysis conducted on geographies consisting of 67,201,096 people shows no correlation between the proportion of Immigrants from Grenada and percentage of population with at least college, 1 year or more education in the United States with a correlation coefficient (R) of -0.017 and weighted average of 54.4%, a difference of 11.2%.
College, 1 year or more Correlation Summary
| Measurement | Scottish | Immigrants from Grenada |
| Minimum | 10.1% | 27.9% |
| Maximum | 100.0% | 91.1% |
| Range | 89.9% | 63.3% |
| Mean | 57.9% | 54.1% |
| Median | 57.5% | 53.4% |
| Interquartile 25% (IQ1) | 48.7% | 48.7% |
| Interquartile 75% (IQ3) | 65.0% | 59.3% |
| Interquartile Range (IQR) | 16.3% | 10.6% |
| Standard Deviation (Sample) | 17.9% | 12.5% |
| Standard Deviation (Population) | 17.8% | 12.4% |
Similar Demographics by College, 1 year or more
Demographics Similar to Scottish by College, 1 year or more
In terms of college, 1 year or more, the demographic groups most similar to Scottish are Slavic (60.6%, a difference of 0.070%), Immigrants from Kenya (60.5%, a difference of 0.090%), Kenyan (60.5%, a difference of 0.10%), Brazilian (60.5%, a difference of 0.10%), and Czech (60.6%, a difference of 0.14%).
| Demographics | Rating | Rank | College, 1 year or more |
| Immigrants | Eritrea | 84.3 /100 | #139 | Excellent 60.7% |
| Iraqis | 83.3 /100 | #140 | Excellent 60.7% |
| Immigrants | Afghanistan | 83.1 /100 | #141 | Excellent 60.7% |
| Poles | 82.8 /100 | #142 | Excellent 60.7% |
| Canadians | 82.7 /100 | #143 | Excellent 60.6% |
| Czechs | 81.9 /100 | #144 | Excellent 60.6% |
| Slavs | 81.1 /100 | #145 | Excellent 60.6% |
| Scottish | 80.2 /100 | #146 | Excellent 60.5% |
| Immigrants | Kenya | 79.1 /100 | #147 | Good 60.5% |
| Kenyans | 79.0 /100 | #148 | Good 60.5% |
| Brazilians | 79.0 /100 | #149 | Good 60.5% |
| Immigrants | Sudan | 77.8 /100 | #150 | Good 60.4% |
| Albanians | 77.8 /100 | #151 | Good 60.4% |
| Immigrants | Germany | 76.1 /100 | #152 | Good 60.3% |
| Sierra Leoneans | 74.1 /100 | #153 | Good 60.2% |
Demographics Similar to Immigrants from Grenada by College, 1 year or more
In terms of college, 1 year or more, the demographic groups most similar to Immigrants from Grenada are Comanche (54.4%, a difference of 0.040%), Belizean (54.4%, a difference of 0.040%), American (54.4%, a difference of 0.060%), Bahamian (54.5%, a difference of 0.080%), and Crow (54.5%, a difference of 0.11%).
| Demographics | Rating | Rank | College, 1 year or more |
| Potawatomi | 0.2 /100 | #266 | Tragic 54.6% |
| Blackfeet | 0.2 /100 | #267 | Tragic 54.6% |
| British West Indians | 0.2 /100 | #268 | Tragic 54.5% |
| Bangladeshis | 0.2 /100 | #269 | Tragic 54.5% |
| Crow | 0.2 /100 | #270 | Tragic 54.5% |
| Bahamians | 0.2 /100 | #271 | Tragic 54.5% |
| Comanche | 0.2 /100 | #272 | Tragic 54.4% |
| Immigrants | Grenada | 0.2 /100 | #273 | Tragic 54.4% |
| Belizeans | 0.2 /100 | #274 | Tragic 54.4% |
| Americans | 0.2 /100 | #275 | Tragic 54.4% |
| Shoshone | 0.2 /100 | #276 | Tragic 54.3% |
| Ecuadorians | 0.2 /100 | #277 | Tragic 54.3% |
| Immigrants | Jamaica | 0.1 /100 | #278 | Tragic 54.2% |
| Arapaho | 0.1 /100 | #279 | Tragic 54.1% |
| Cheyenne | 0.1 /100 | #280 | Tragic 54.1% |