Menominee vs Immigrants from Grenada College, 1 year or more
COMPARE
Menominee
Immigrants from Grenada
College, 1 year or more
College, 1 year or more Comparison
Menominee
Immigrants from Grenada
50.6%
COLLEGE, 1 YEAR OR MORE
0.0/ 100
METRIC RATING
327th/ 347
METRIC RANK
54.4%
COLLEGE, 1 YEAR OR MORE
0.2/ 100
METRIC RATING
273rd/ 347
METRIC RANK
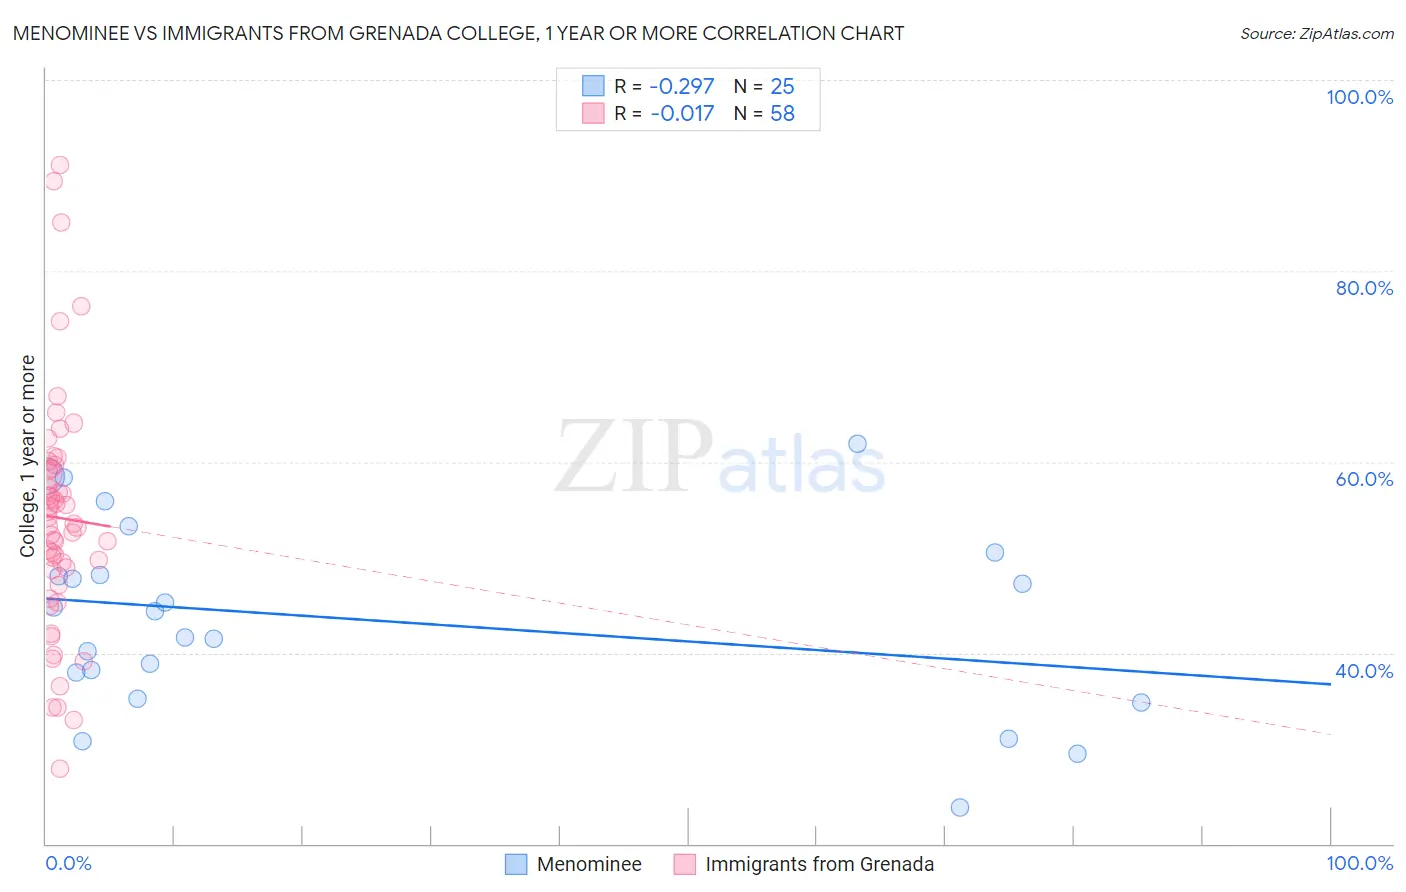
Menominee vs Immigrants from Grenada College, 1 year or more Correlation Chart
The statistical analysis conducted on geographies consisting of 45,778,860 people shows a weak negative correlation between the proportion of Menominee and percentage of population with at least college, 1 year or more education in the United States with a correlation coefficient (R) of -0.297 and weighted average of 50.6%. Similarly, the statistical analysis conducted on geographies consisting of 67,201,096 people shows no correlation between the proportion of Immigrants from Grenada and percentage of population with at least college, 1 year or more education in the United States with a correlation coefficient (R) of -0.017 and weighted average of 54.4%, a difference of 7.6%.
College, 1 year or more Correlation Summary
| Measurement | Menominee | Immigrants from Grenada |
| Minimum | 23.8% | 27.9% |
| Maximum | 61.9% | 91.1% |
| Range | 38.1% | 63.3% |
| Mean | 43.5% | 54.1% |
| Median | 44.3% | 53.4% |
| Interquartile 25% (IQ1) | 36.6% | 48.7% |
| Interquartile 75% (IQ3) | 49.3% | 59.3% |
| Interquartile Range (IQR) | 12.7% | 10.6% |
| Standard Deviation (Sample) | 9.8% | 12.5% |
| Standard Deviation (Population) | 9.6% | 12.4% |
Similar Demographics by College, 1 year or more
Demographics Similar to Menominee by College, 1 year or more
In terms of college, 1 year or more, the demographic groups most similar to Menominee are Dominican (50.6%, a difference of 0.040%), Dutch West Indian (50.5%, a difference of 0.12%), Immigrants from Latin America (50.7%, a difference of 0.22%), Immigrants from Cuba (50.7%, a difference of 0.25%), and Immigrants from Guatemala (50.7%, a difference of 0.26%).
| Demographics | Rating | Rank | College, 1 year or more |
| Kiowa | 0.0 /100 | #320 | Tragic 51.0% |
| Hopi | 0.0 /100 | #321 | Tragic 50.9% |
| Navajo | 0.0 /100 | #322 | Tragic 50.8% |
| Immigrants | Guatemala | 0.0 /100 | #323 | Tragic 50.7% |
| Immigrants | Cuba | 0.0 /100 | #324 | Tragic 50.7% |
| Immigrants | Latin America | 0.0 /100 | #325 | Tragic 50.7% |
| Dominicans | 0.0 /100 | #326 | Tragic 50.6% |
| Menominee | 0.0 /100 | #327 | Tragic 50.6% |
| Dutch West Indians | 0.0 /100 | #328 | Tragic 50.5% |
| Cape Verdeans | 0.0 /100 | #329 | Tragic 50.3% |
| Natives/Alaskans | 0.0 /100 | #330 | Tragic 50.2% |
| Immigrants | Yemen | 0.0 /100 | #331 | Tragic 50.0% |
| Mexicans | 0.0 /100 | #332 | Tragic 49.2% |
| Immigrants | Dominican Republic | 0.0 /100 | #333 | Tragic 49.1% |
| Lumbee | 0.0 /100 | #334 | Tragic 48.9% |
Demographics Similar to Immigrants from Grenada by College, 1 year or more
In terms of college, 1 year or more, the demographic groups most similar to Immigrants from Grenada are Comanche (54.4%, a difference of 0.040%), Belizean (54.4%, a difference of 0.040%), American (54.4%, a difference of 0.060%), Bahamian (54.5%, a difference of 0.080%), and Crow (54.5%, a difference of 0.11%).
| Demographics | Rating | Rank | College, 1 year or more |
| Potawatomi | 0.2 /100 | #266 | Tragic 54.6% |
| Blackfeet | 0.2 /100 | #267 | Tragic 54.6% |
| British West Indians | 0.2 /100 | #268 | Tragic 54.5% |
| Bangladeshis | 0.2 /100 | #269 | Tragic 54.5% |
| Crow | 0.2 /100 | #270 | Tragic 54.5% |
| Bahamians | 0.2 /100 | #271 | Tragic 54.5% |
| Comanche | 0.2 /100 | #272 | Tragic 54.4% |
| Immigrants | Grenada | 0.2 /100 | #273 | Tragic 54.4% |
| Belizeans | 0.2 /100 | #274 | Tragic 54.4% |
| Americans | 0.2 /100 | #275 | Tragic 54.4% |
| Shoshone | 0.2 /100 | #276 | Tragic 54.3% |
| Ecuadorians | 0.2 /100 | #277 | Tragic 54.3% |
| Immigrants | Jamaica | 0.1 /100 | #278 | Tragic 54.2% |
| Arapaho | 0.1 /100 | #279 | Tragic 54.1% |
| Cheyenne | 0.1 /100 | #280 | Tragic 54.1% |