Yakama vs Immigrants from Trinidad and Tobago College, 1 year or more

COMPARE

Yakama
Race
Ancestry
AfghanAfricanAlaska NativeAlaskan AthabascanAlbanianAleutAlsatianAmericanApacheArabArapahoArgentineanArmenianAssyrian/Chaldean/SyriacAustralianAustrianBahamianBangladeshiBarbadianBasqueBelgianBelizeanBermudanBhutaneseBlackfeetBolivianBrazilianBritishBritish West IndianBulgarianBurmeseCajunCambodianCanadianCape VerdeanCarpatho RusynCelticCentral AmericanCentral American IndianCherokeeCheyenneChickasawChileanChineseChippewaChoctawColombianColvilleComancheCosta RicanCreeCreekCroatianCrowCubanCypriotCzechCzechoslovakianDanishDelawareDominicanDutchDutch West IndianEastern EuropeanEcuadorianEgyptianEnglishEstonianEthiopianEuropeanFijianFilipinoFinnishFrenchFrench American IndianFrench CanadianGermanGerman RussianGhanaianGreekGuamanian/ChamorroGuatemalanGuyaneseHaitianHmongHonduranHopiHoumaHungarianIcelanderIndian (Asian)IndonesianInupiatIranianIraqiIrishIroquoisIsraeliItalianJamaicanJapaneseJordanianKenyanKiowaKoreanLaotianLatvianLebaneseLiberianLithuanianLumbeeLuxembourgerMacedonianMalaysianMalteseMarshalleseMenomineeMexicanMexican American IndianMongolianMoroccanNative HawaiianNavajoNepaleseNew ZealanderNicaraguanNigerianNorthern EuropeanNorwegianOkinawanOsageOttawaPaiutePakistaniPalestinianPanamanianParaguayanPennsylvania GermanPeruvianPimaPolishPortuguesePotawatomiPuebloPuerto RicanPuget Sound SalishRomanianRussianSalvadoranSamoanScandinavianScotch-IrishScottishSeminoleSenegaleseSerbianShoshoneSierra LeoneanSiouxSlavicSlovakSloveneSomaliSouth AfricanSouth AmericanSouth American IndianSoviet UnionSpaniardSpanishSpanish AmericanSpanish American IndianSri LankanSubsaharan AfricanSudaneseSwedishSwissSyrianTaiwaneseThaiTlingit-HaidaTohono O'OdhamTonganTrinidadian and TobagonianTsimshianTurkishU.S. Virgin IslanderUgandanUkrainianUruguayanUteVenezuelanVietnameseWelshWest IndianYakamaYaquiYugoslavianYumanYup'ikZimbabwean
Immigration
NonimmigrantsImmigrantsAfghanistanAfricaAlbaniaArgentinaArmeniaAsiaAustraliaAustriaBahamasBangladeshBarbadosBelarusBelgiumBelizeBoliviaBosnia and HerzegovinaBrazilBulgariaBurma/MyanmarCabo VerdeCambodiaCameroonCanadaCaribbeanCentral AmericaChileChinaColombiaCongoCosta RicaCroatiaCubaCzechoslovakiaDenmarkDominicaDominican RepublicEastern AfricaEastern AsiaEastern EuropeEcuadorEgyptEl SalvadorEnglandEritreaEthiopiaEuropeFijiFranceGermanyGhanaGreeceGrenadaGuatemalaGuyanaHaitiHondurasHong KongHungaryIndiaIndonesiaIranIraqIrelandIsraelItalyJamaicaJapanJordanKazakhstanKenyaKoreaKuwaitLaosLatin AmericaLatviaLebanonLiberiaLithuaniaMalaysiaMexicoMicronesiaMiddle AfricaMoldovaMoroccoNepalNetherlandsNicaraguaNigeriaNorth AmericaNorth MacedoniaNorthern AfricaNorthern EuropeNorwayOceaniaPakistanPanamaPeruPhilippinesPolandPortugalRomaniaRussiaSaudi ArabiaScotlandSenegalSerbiaSierra LeoneSingaporeSomaliaSouth AfricaSouth AmericaSouth Central AsiaSouth Eastern AsiaSouthern EuropeSpainSri LankaSt. Vincent and the GrenadinesSudanSwedenSwitzerlandSyriaTaiwanThailandTurkeyUgandaUkraineUruguayUzbekistanVenezuelaVietnamWest IndiesWestern AfricaWestern AsiaWestern EuropeYemenZaireZimbabweAzores
Immigrants from Trinidad and Tobago
Race
Ancestry
AfghanAfricanAlaska NativeAlaskan AthabascanAlbanianAleutAlsatianAmericanApacheArabArapahoArgentineanArmenianAssyrian/Chaldean/SyriacAustralianAustrianBahamianBangladeshiBarbadianBasqueBelgianBelizeanBermudanBhutaneseBlackfeetBolivianBrazilianBritishBritish West IndianBulgarianBurmeseCajunCambodianCanadianCape VerdeanCarpatho RusynCelticCentral AmericanCentral American IndianCherokeeCheyenneChickasawChileanChineseChippewaChoctawColombianColvilleComancheCosta RicanCreeCreekCroatianCrowCubanCypriotCzechCzechoslovakianDanishDelawareDominicanDutchDutch West IndianEastern EuropeanEcuadorianEgyptianEnglishEstonianEthiopianEuropeanFijianFilipinoFinnishFrenchFrench American IndianFrench CanadianGermanGerman RussianGhanaianGreekGuamanian/ChamorroGuatemalanGuyaneseHaitianHmongHonduranHopiHoumaHungarianIcelanderIndian (Asian)IndonesianInupiatIranianIraqiIrishIroquoisIsraeliItalianJamaicanJapaneseJordanianKenyanKiowaKoreanLaotianLatvianLebaneseLiberianLithuanianLumbeeLuxembourgerMacedonianMalaysianMalteseMarshalleseMenomineeMexicanMexican American IndianMongolianMoroccanNative HawaiianNavajoNepaleseNew ZealanderNicaraguanNigerianNorthern EuropeanNorwegianOkinawanOsageOttawaPaiutePakistaniPalestinianPanamanianParaguayanPennsylvania GermanPeruvianPimaPolishPortuguesePotawatomiPuebloPuerto RicanPuget Sound SalishRomanianRussianSalvadoranSamoanScandinavianScotch-IrishScottishSeminoleSenegaleseSerbianShoshoneSierra LeoneanSiouxSlavicSlovakSloveneSomaliSouth AfricanSouth AmericanSouth American IndianSoviet UnionSpaniardSpanishSpanish AmericanSpanish American IndianSri LankanSubsaharan AfricanSudaneseSwedishSwissSyrianTaiwaneseThaiTlingit-HaidaTohono O'OdhamTonganTrinidadian and TobagonianTsimshianTurkishU.S. Virgin IslanderUgandanUkrainianUruguayanUteVenezuelanVietnameseWelshWest IndianYaquiYugoslavianYumanYup'ikZimbabwean
Immigration
NonimmigrantsImmigrantsAfghanistanAfricaAlbaniaArgentinaArmeniaAsiaAustraliaAustriaBahamasBangladeshBarbadosBelarusBelgiumBelizeBoliviaBosnia and HerzegovinaBrazilBulgariaBurma/MyanmarCabo VerdeCambodiaCameroonCanadaCaribbeanCentral AmericaChileChinaColombiaCongoCosta RicaCroatiaCubaCzechoslovakiaDenmarkDominicaDominican RepublicEastern AfricaEastern AsiaEastern EuropeEcuadorEgyptEl SalvadorEnglandEritreaEthiopiaEuropeFijiFranceGermanyGhanaGreeceGrenadaGuatemalaGuyanaHaitiHondurasHong KongHungaryIndiaIndonesiaIranIraqIrelandIsraelItalyJamaicaJapanJordanKazakhstanKenyaKoreaKuwaitLaosLatin AmericaLatviaLebanonLiberiaLithuaniaMalaysiaMexicoMicronesiaMiddle AfricaMoldovaMoroccoNepalNetherlandsNicaraguaNigeriaNorth AmericaNorth MacedoniaNorthern AfricaNorthern EuropeNorwayOceaniaPakistanPanamaPeruPhilippinesPolandPortugalRomaniaRussiaSaudi ArabiaScotlandSenegalSerbiaSierra LeoneSingaporeSomaliaSouth AfricaSouth AmericaSouth Central AsiaSouth Eastern AsiaSouthern EuropeSpainSri LankaSt. Vincent and the GrenadinesSudanSwedenSwitzerlandSyriaTaiwanThailandTrinidad and TobagoTurkeyUgandaUkraineUruguayUzbekistanVenezuelaVietnamWest IndiesWestern AfricaWestern AsiaWestern EuropeYemenZaireZimbabweAzores
College, 1 year or more
Income
Poverty
Unemployment
Labor Participation
Family Structure
Vehicle Availability
Education Level
Disability

College, 1 year or more Comparison

Yakama

Immigrants from Trinidad and Tobago

Tragic
Tragic
46.2%
COLLEGE, 1 YEAR OR MORE
0.0/ 100
METRIC RATING
344th/ 347
METRIC RANK
55.5%
COLLEGE, 1 YEAR OR MORE
0.7/ 100
METRIC RATING
249th/ 347
METRIC RANK

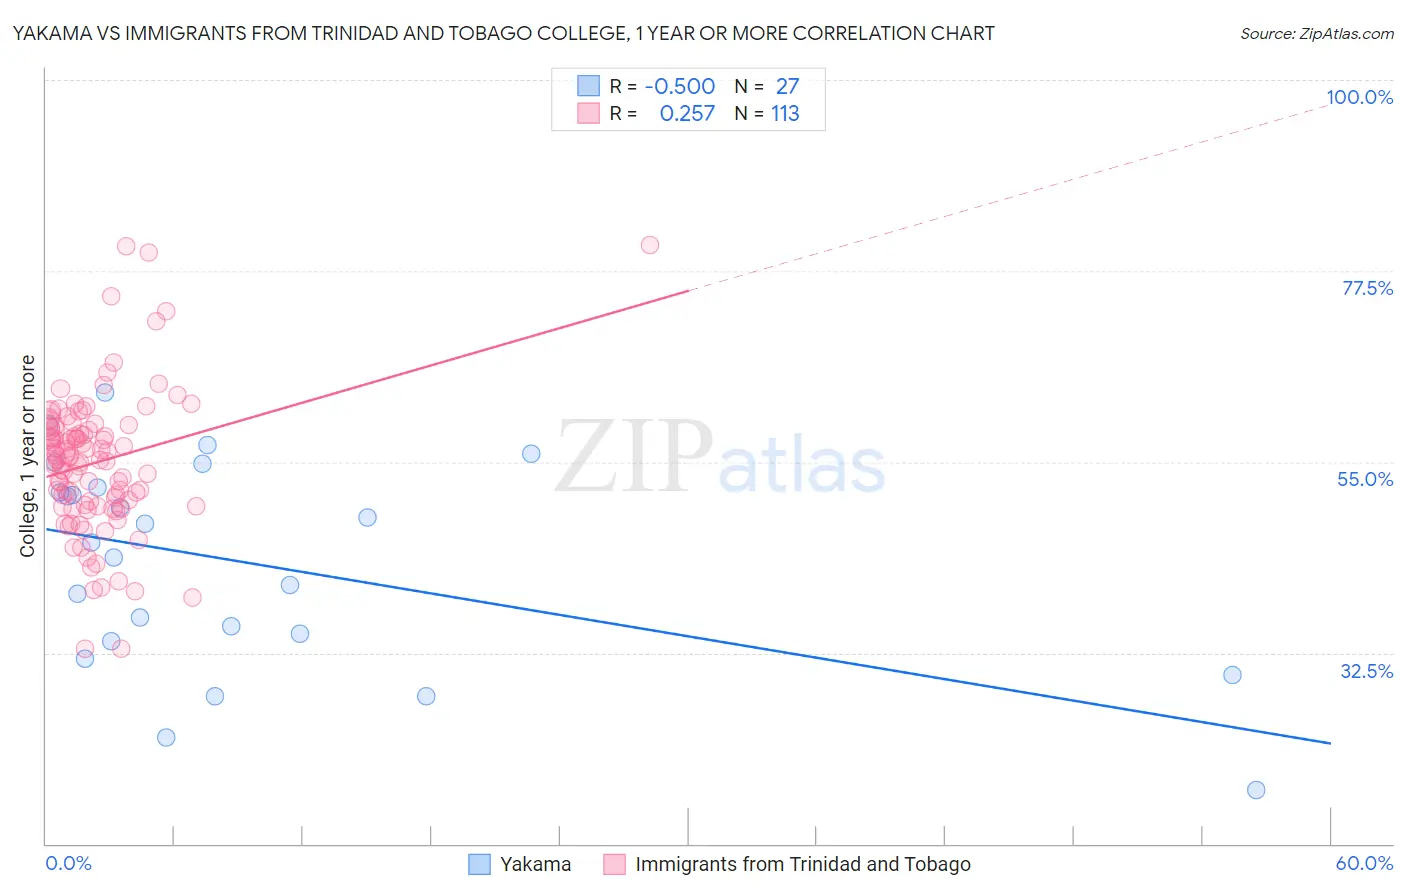
Yakama vs Immigrants from Trinidad and Tobago College, 1 year or more Correlation Chart

The statistical analysis conducted on geographies consisting of 19,923,144 people shows a moderate negative correlation between the proportion of Yakama and percentage of population with at least college, 1 year or more education in the United States with a correlation coefficient (R) of -0.500 and weighted average of 46.2%. Similarly, the statistical analysis conducted on geographies consisting of 223,526,872 people shows a weak positive correlation between the proportion of Immigrants from Trinidad and Tobago and percentage of population with at least college, 1 year or more education in the United States with a correlation coefficient (R) of 0.257 and weighted average of 55.5%, a difference of 20.1%.
Yakama vs Immigrants from Trinidad and Tobago College, 1 year or more

College, 1 year or more Correlation Summary

MeasurementYakamaImmigrants from Trinidad and Tobago
Minimum16.3%32.9%
Maximum63.1%80.5%
Range46.8%47.6%
Mean43.0%54.9%
Median45.5%55.2%
Interquartile 25% (IQ1)33.9%49.8%
Interquartile 75% (IQ3)52.0%58.9%
Interquartile Range (IQR)18.1%9.1%
Standard Deviation (Sample)12.2%8.3%
Standard Deviation (Population)12.0%8.3%

Similar Demographics by College, 1 year or more

Demographics Similar to Yakama by College, 1 year or more

In terms of college, 1 year or more, the demographic groups most similar to Yakama are Pima (45.6%, a difference of 1.3%), Tohono O'odham (47.1%, a difference of 2.0%), Inupiat (47.2%, a difference of 2.2%), Immigrants from Mexico (47.5%, a difference of 2.8%), and Immigrants from Cabo Verde (48.1%, a difference of 4.0%).
DemographicsRating | RankCollege, 1 year or more
Immigrants | Dominican Republic
0.0
/100
|
#333
Tragic
49.1%
Lumbee
0.0
/100
|
#334
Tragic
48.9%
Yuman
0.0
/100
|
#335
Tragic
48.7%
Spanish American Indians
0.0
/100
|
#336
Tragic
48.5%
Pennsylvania Germans
0.0
/100
|
#337
Tragic
48.5%
Immigrants | Central America
0.0
/100
|
#338
Tragic
48.5%
Immigrants | Azores
0.0
/100
|
#339
Tragic
48.4%
Immigrants | Cabo Verde
0.0
/100
|
#340
Tragic
48.1%
Immigrants | Mexico
0.0
/100
|
#341
Tragic
47.5%
Inupiat
0.0
/100
|
#342
Tragic
47.2%
Tohono O'odham
0.0
/100
|
#343
Tragic
47.1%
Yakama
0.0
/100
|
#344
Tragic
46.2%
Pima
0.0
/100
|
#345
Tragic
45.6%
Houma
0.0
/100
|
#346
Tragic
41.2%
Yup'ik
0.0
/100
|
#347
Tragic
39.4%

Demographics Similar to Immigrants from Trinidad and Tobago by College, 1 year or more

In terms of college, 1 year or more, the demographic groups most similar to Immigrants from Trinidad and Tobago are Delaware (55.5%, a difference of 0.020%), Immigrants from Congo (55.6%, a difference of 0.10%), Immigrants from Cambodia (55.4%, a difference of 0.11%), Hawaiian (55.6%, a difference of 0.13%), and Aleut (55.4%, a difference of 0.14%).
DemographicsRating | RankCollege, 1 year or more
Marshallese
1.0
/100
|
#242
Tragic
55.8%
Osage
1.0
/100
|
#243
Tragic
55.8%
Chippewa
0.9
/100
|
#244
Tragic
55.7%
Immigrants | Liberia
0.8
/100
|
#245
Tragic
55.7%
Malaysians
0.8
/100
|
#246
Tragic
55.6%
Hawaiians
0.8
/100
|
#247
Tragic
55.6%
Immigrants | Congo
0.8
/100
|
#248
Tragic
55.6%
Immigrants | Trinidad and Tobago
0.7
/100
|
#249
Tragic
55.5%
Delaware
0.7
/100
|
#250
Tragic
55.5%
Immigrants | Cambodia
0.6
/100
|
#251
Tragic
55.4%
Aleuts
0.6
/100
|
#252
Tragic
55.4%
Immigrants | Barbados
0.6
/100
|
#253
Tragic
55.4%
Japanese
0.5
/100
|
#254
Tragic
55.2%
Immigrants | Bahamas
0.5
/100
|
#255
Tragic
55.2%
Immigrants | West Indies
0.5
/100
|
#256
Tragic
55.2%